Skip to content
stuff to do in.cologne

District

Rath/Heumar

Part of borough Kalk

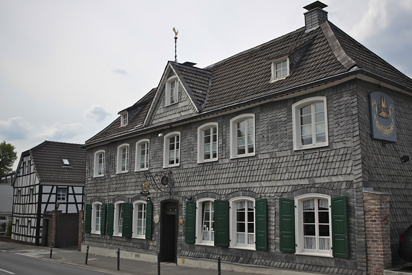
Rath/Heumar is a district of Cologne on the right bank of the Rhine, belonging to the borough of Kalk. This twin settlement was formed in the 1975 North Rhine-Westphalian territorial reform by merging the two former villages of Rath and Heumar. Geographically, it forms part of the Bergisches Land region.

Source: Wikipedia
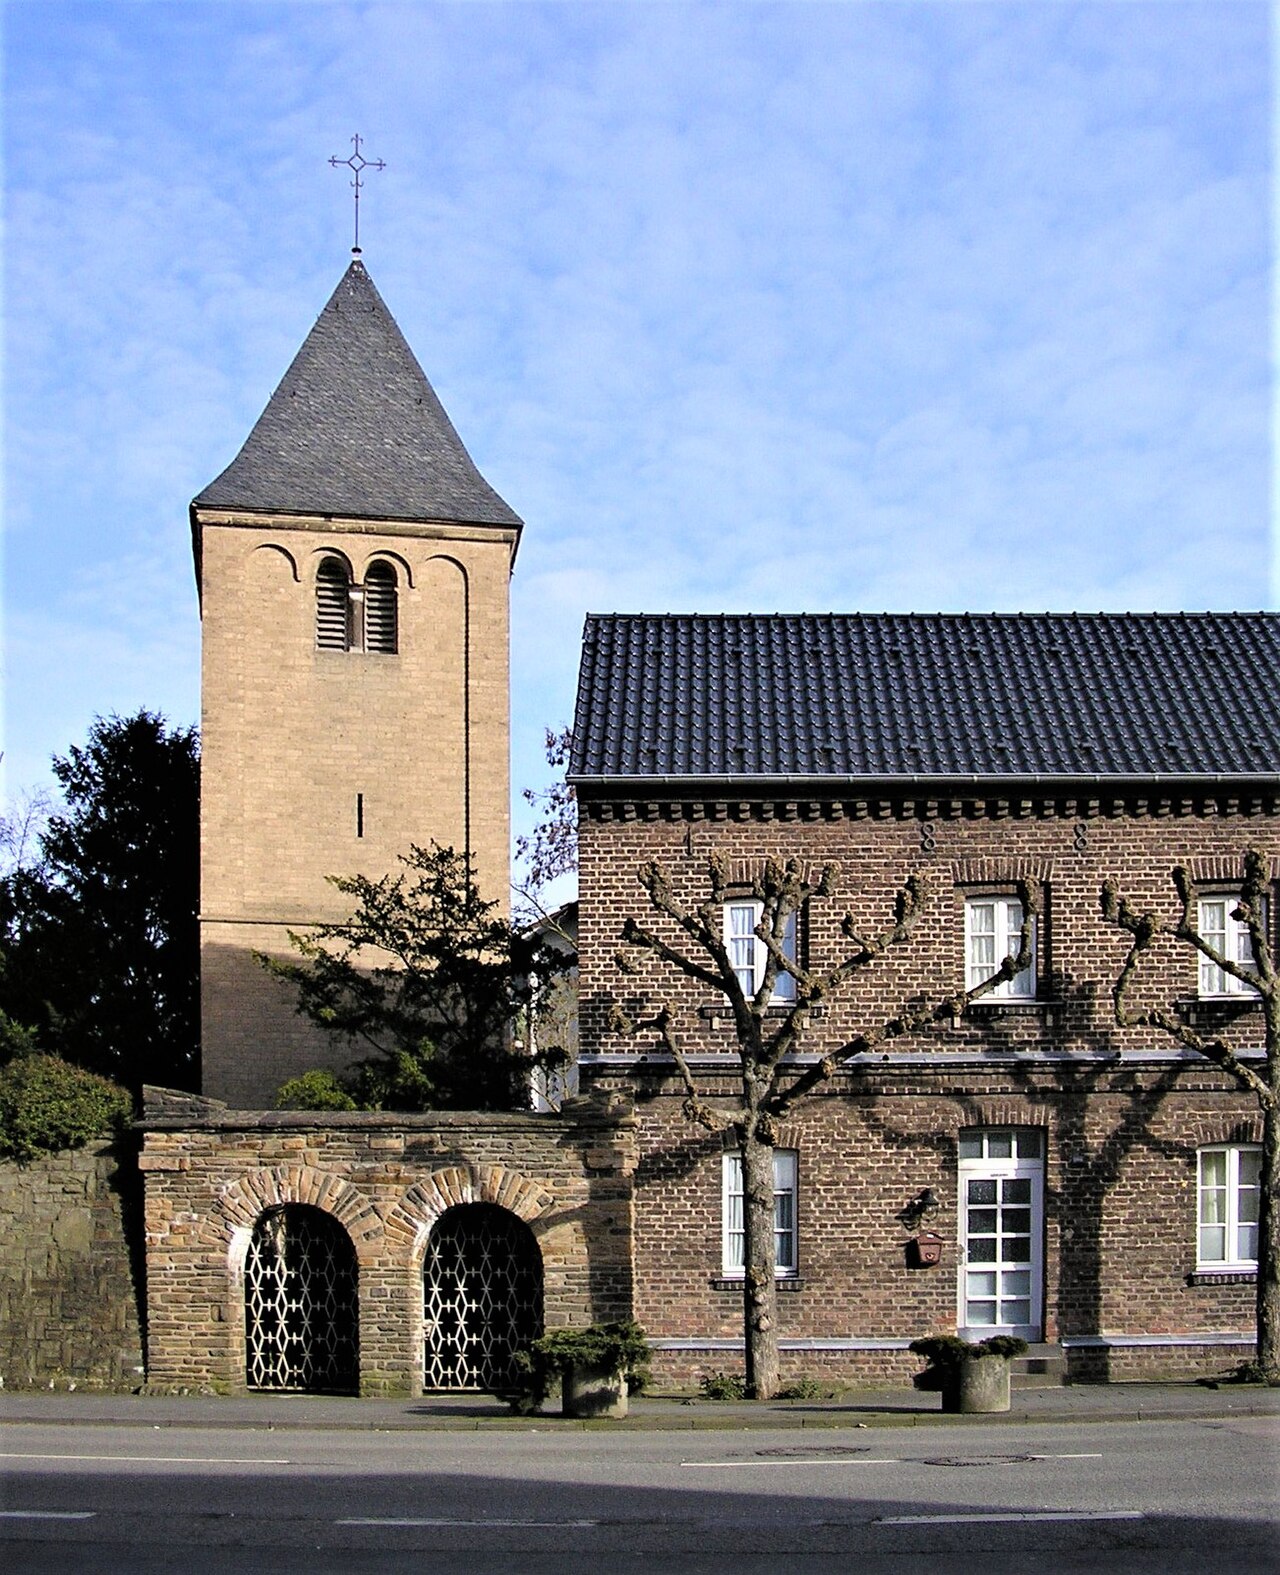
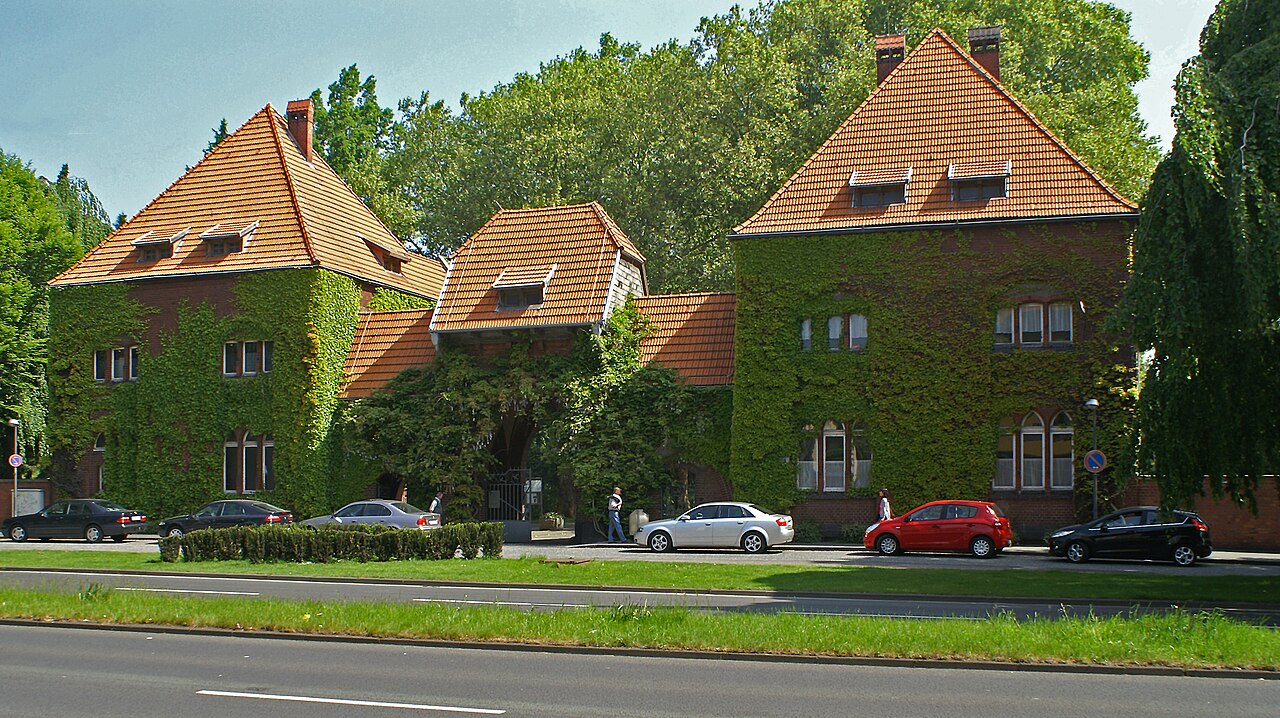
Rath/Heumar
© Chris06 · Public domain
0
Inhabitants
0 km²
Area
0
Inhabitants/km² · Cologne 2,716
0
Households

Each bar shows the share relative to the highest value among 86 districts; the line marks the Cologne average.

Compare with borough & neighbouring districts

Tick areas — their values appear as coloured markers on the bars below.

Age structure

0–17 yrs16.2% · CGN 15.7% · Rank 54/86
18–30 yrs12.2% · CGN 16.1% · Rank 66/86
30–65 yrs48.3% · CGN 49.9% · Rank 49/86
65–80 yrs15.3% · CGN 12.5% · Rank 15/86
80+ yrs8% · CGN 5.8% · Rank 12/86

Source: Cologne neighbourhood monitoring

Population & social

migration background31% · CGN 43.1% · Rank 70/86
foreign nationals14% · CGN 21.6% · Rank 69/86
unemployment rate6.4% · CGN 8.8% · Rank 60/86
on benefits (SGB II)4% · CGN 6.1% · Rank 57/86
employment rate63.3% · CGN 60.1% · Rank 15/86

Source: Cologne neighbourhood monitoring

Households

single-person43.7% · CGN 51.9% · Rank 45/86
couples with children15.8% · CGN 13.7% · Rank 46/86
single parents3.7% · CGN 4% · Rank 61/86

Source: Cologne neighbourhood monitoring

Land use

green space (total)70.1% · CGN 44.9% · Rank 7/86
parks1.6% · CGN 10.3% · Rank 84/86
forest58.1% · CGN 18.7% · Rank 3/86
water2.3% · CGN 4.8% · Rank 37/86
built-up17.8% · CGN 32.9% · Rank 75/86

Source: Cologne neighbourhood monitoring

Political leaning

NRW state election 2022, party-list votes — bars relative to the strongest result, percentages beside.

Tick areas — their values appear as coloured markers on the bars.

CDU36.3% · CGN 24.6% · Rank 16/86
Greens20.5% · CGN 30.6% · Rank 52/86
SPD23.1% · CGN 23.2% · Rank 57/86
AfD4.2% · CGN 3.6% · Rank 50/86
The Left1.6% · CGN 3.7% · Rank 70/86
FDP7.9% · CGN 6.4% · Rank 12/86
Volt1.4% · CGN 2.4% · Rank 51/86

Source: Election and structural data, Cologne geoportal

Per 10,000 inhabitants

Counts in the area, relative to population — fairly comparable.

Tick areas — their values appear as coloured markers on the bars.

Family & everyday

Schools1.7 · CGN 3.2 · Rank 67/82
Daycare1.7 · CGN 1.6 · Rank 35/70
Playgrounds3.4 · CGN 6.4 · Rank 78/85
Supermarkets2.5 · CGN 3.4 · Rank 55/86
Weekly markets0.8 · CGN 0.4 · Rank 10/86

Health & mobility

Hospitals0 · CGN 0.3 · Rank 21/86
Pharmacies2.5 · CGN 2 · Rank 18/86
Transit stops8.5 · CGN 3.9 · Rank 6/52
Recycling points5.9 · CGN 9.5 · Rank 66/86
Drinking fountains0 · CGN 0.2 · Rank 17/86
EV charging1.7 · CGN 4.2 · Rank 63/86

Sources: City of Cologne open data & geoportal (schools, daycare, playgrounds, transit, hospitals, libraries) and OpenStreetMap contributors (ODbL; pharmacies, supermarkets, markets, recycling, fountains, EV charging)

What's in this area

Counted within the boundary from open data — City of Cologne (geoportal/open data) and OpenStreetMap contributors (ODbL). Every number links to its source.

Neighbouring districts
Brück
Average age
46 (1.)
Employment
59.6% (3.)
Strongest party
CDU
Green space
65.7% (2.)
Höhenberg
Average age
42 (4.)
Employment
56.2% (5.)
Strongest party
SPD
Green space
39.2% (4.)
Humboldt/Gremberg
Average age
41 (6.)
Employment
58.6% (4.)
Strongest party
SPD
Green space
35.8% (5.)
Kalk
Average age
40 (9.)
Employment
54.6% (6.)
Strongest party
Grüne
Green space
6.9% (9.)
Merheim
Average age
41 (5.)
Employment
61.2% (2.)
Strongest party
CDU
Green space
30.9% (6.)
Neubrück
Average age
42 (3.)
Employment
52.5% (8.)
Strongest party
CDU
Green space
25% (7.)
Ostheim
Average age
40 (8.)
Employment
50.7% (9.)
Strongest party
SPD
Green space
47.6% (3.)
Vingst
Average age
41 (7.)
Employment
53.6% (7.)
Strongest party
SPD
Green space
18.8% (8.)

Comments

  • Loading comments…

Sources & links

How this page is made

This page draws on open sources — Wikipedia, Wikidata, official websites and the city’s open data. Every statement is checked against the sources linked here, and pages are refreshed regularly.

Spotted a mistake anyway? Tell us below — we read every submission.

Something missing or wrong?

Help us improve — suggest an edit or a new place.