District
Humboldt/Gremberg
Part of borough Kalk
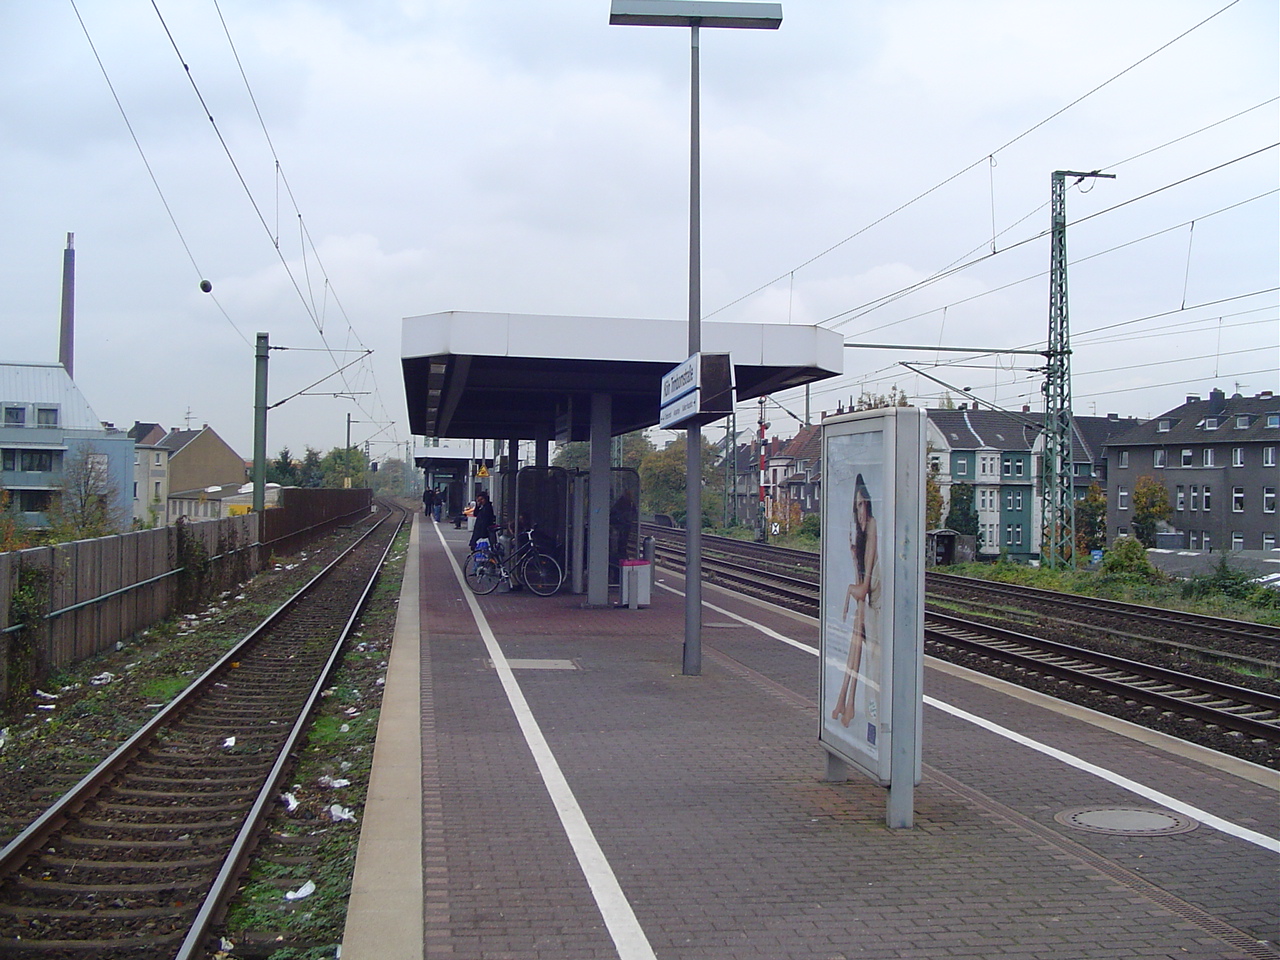
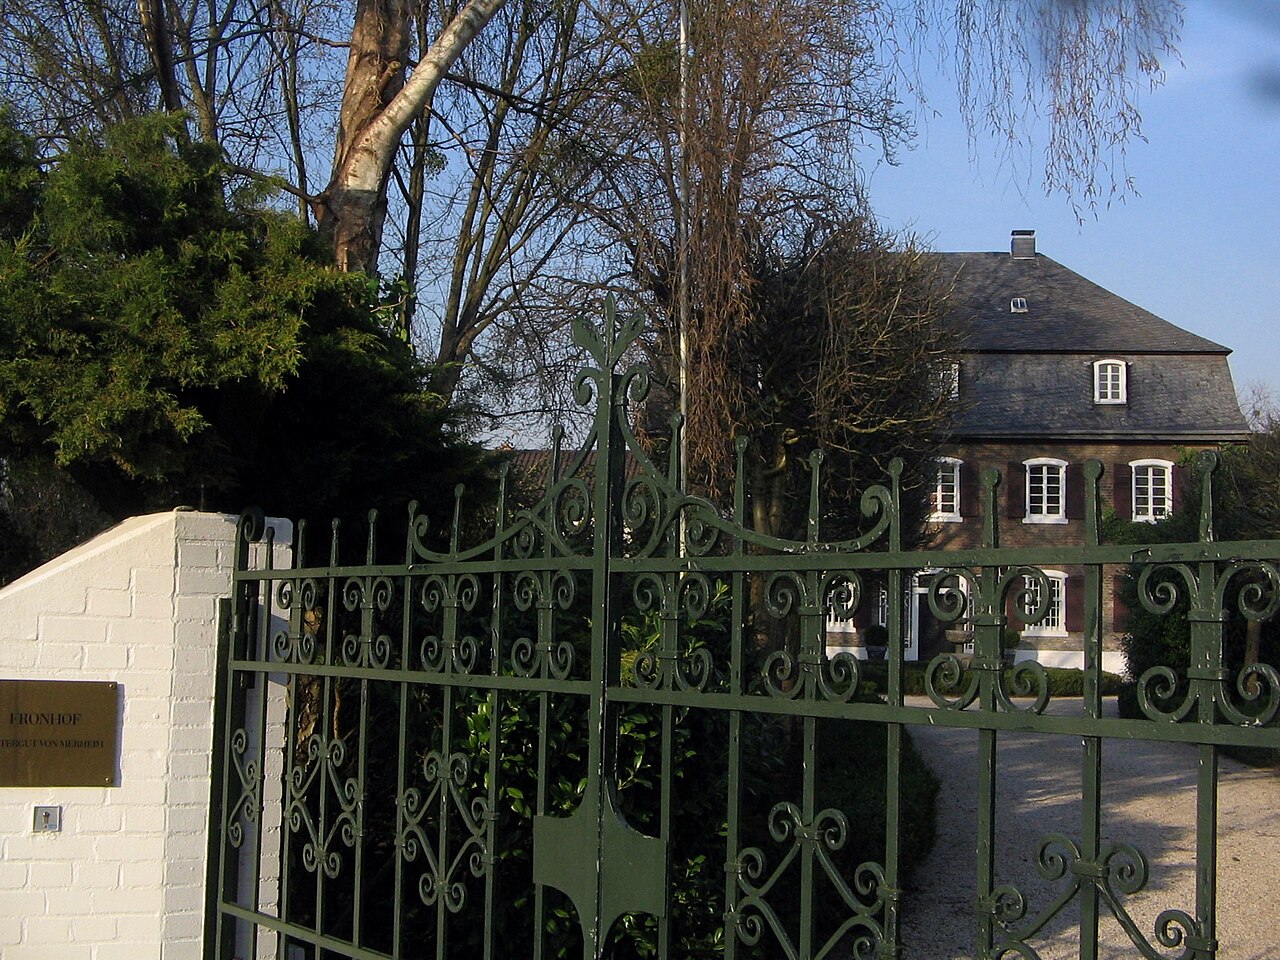
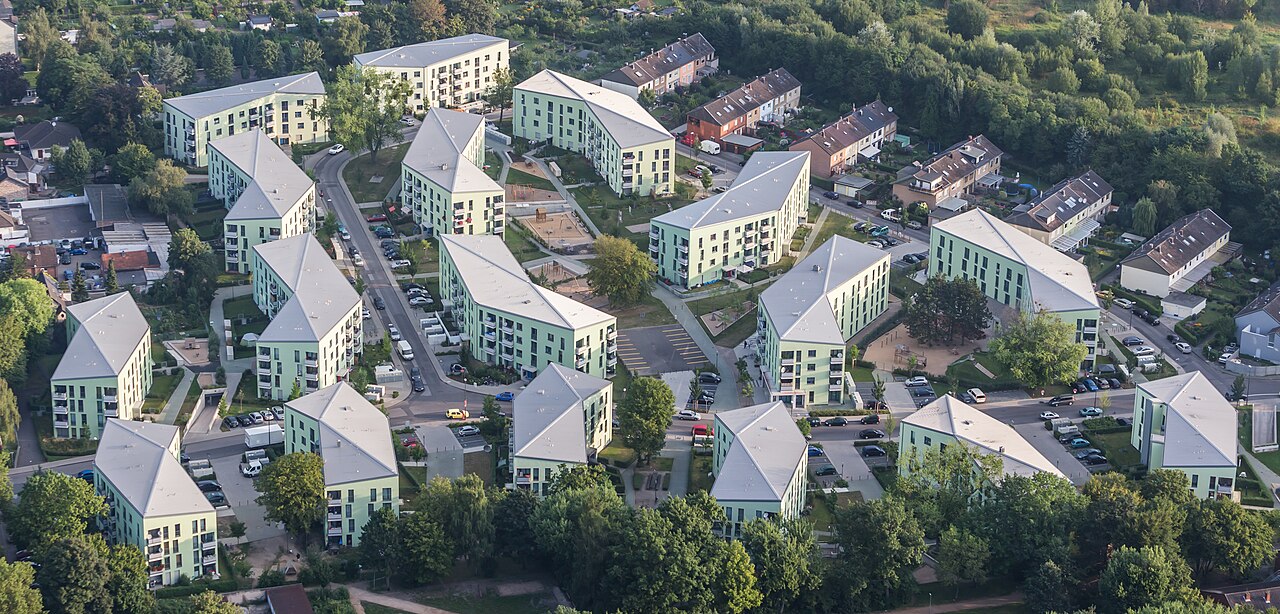
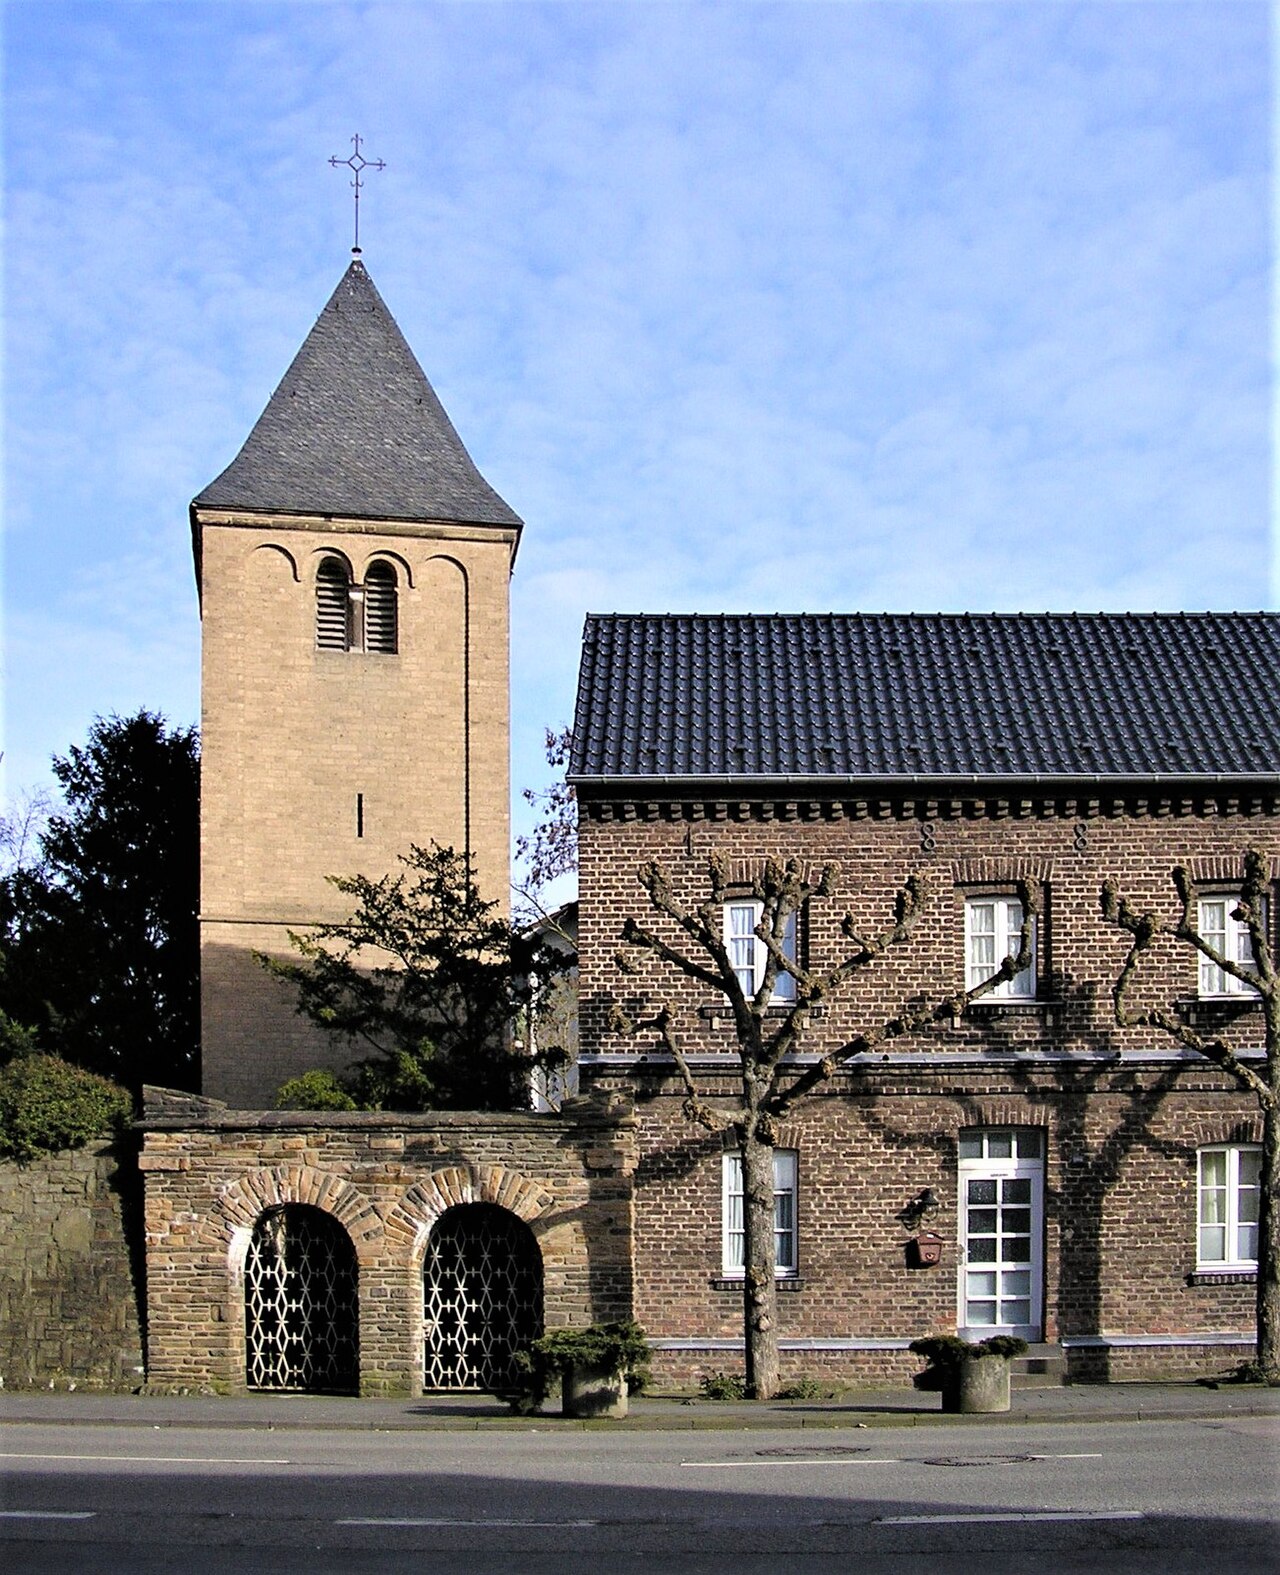
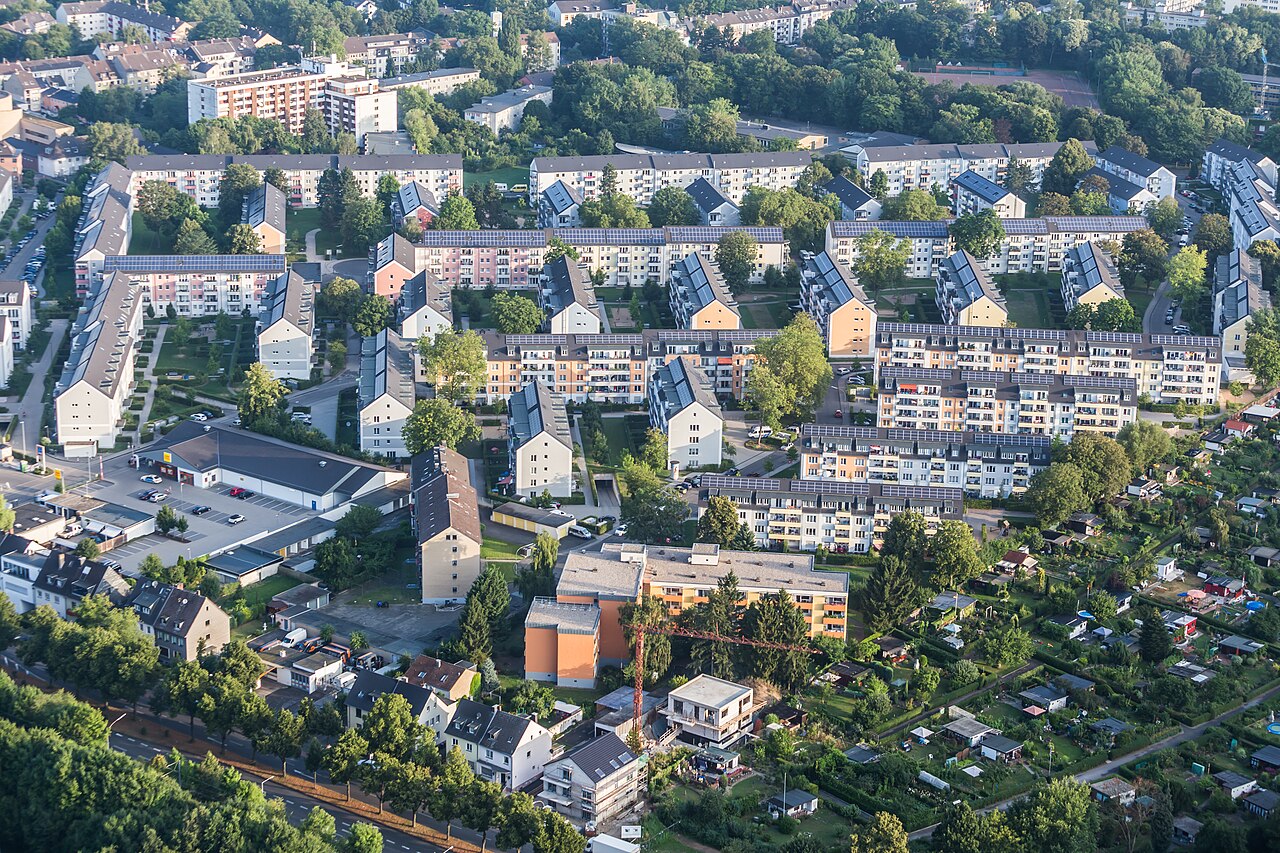
Humboldt/Gremberg is an eastern district of Cologne in the right-bank borough of Kalk, formed in 1975 when a territorial reform merged two formerly independent localities. Humboldt arose only during the industrialisation of the later 19th century and was incorporated into Cologne in 1888, whereas the Gremberg area is documented as far back as 1003 and was annexed in 1910. Both grew into working-class neighbourhoods serving the nearby factories during the 20th century, and after those plants closed the area was added to the "Kalk-Programm" funding scheme in 1994. Today its streetscape is shaped by renovated post-war buildings alongside many well-preserved homes from the Gründerzeit era.
Source: Wikipedia
Each bar shows the share relative to the highest value among 86 districts; the line marks the Cologne average.
Compare with borough & neighbouring districts
Tick areas — their values appear as coloured markers on the bars below.
Age structure
Source: Cologne neighbourhood monitoring
Population & social
Source: Cologne neighbourhood monitoring
Households
Source: Cologne neighbourhood monitoring
Land use
Source: Cologne neighbourhood monitoring
Political leaning
NRW state election 2022, party-list votes — bars relative to the strongest result, percentages beside.
Tick areas — their values appear as coloured markers on the bars.
Per 10,000 inhabitants
Counts in the area, relative to population — fairly comparable.
Tick areas — their values appear as coloured markers on the bars.
Family & everyday
Health & mobility
Sources: City of Cologne open data & geoportal (schools, daycare, playgrounds, transit, hospitals, libraries) and OpenStreetMap contributors (ODbL; pharmacies, supermarkets, markets, recycling, fountains, EV charging)
What's in this area
Counted within the boundary from open data — City of Cologne (geoportal/open data) and OpenStreetMap contributors (ODbL). Every number links to its source.
Neighbouring districts
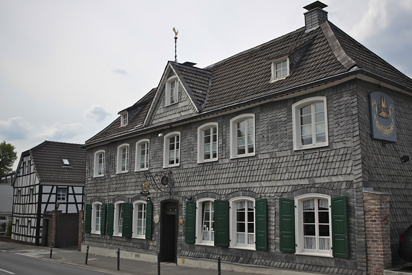
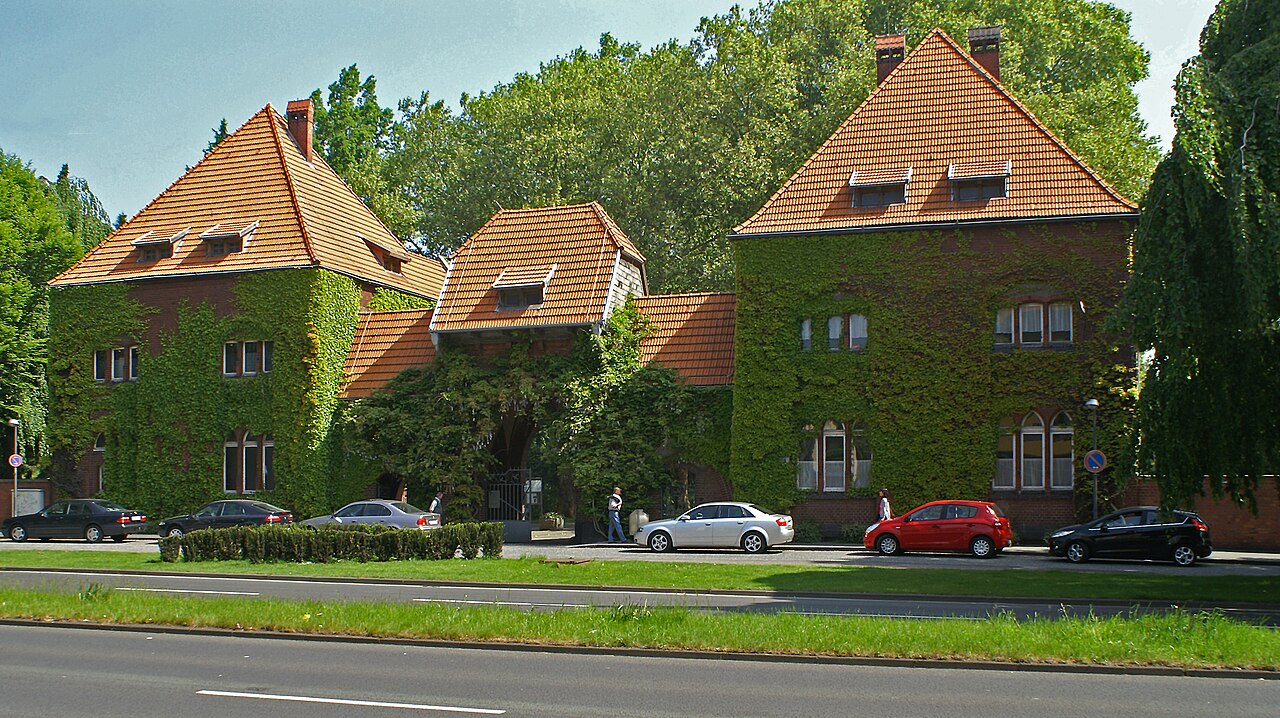
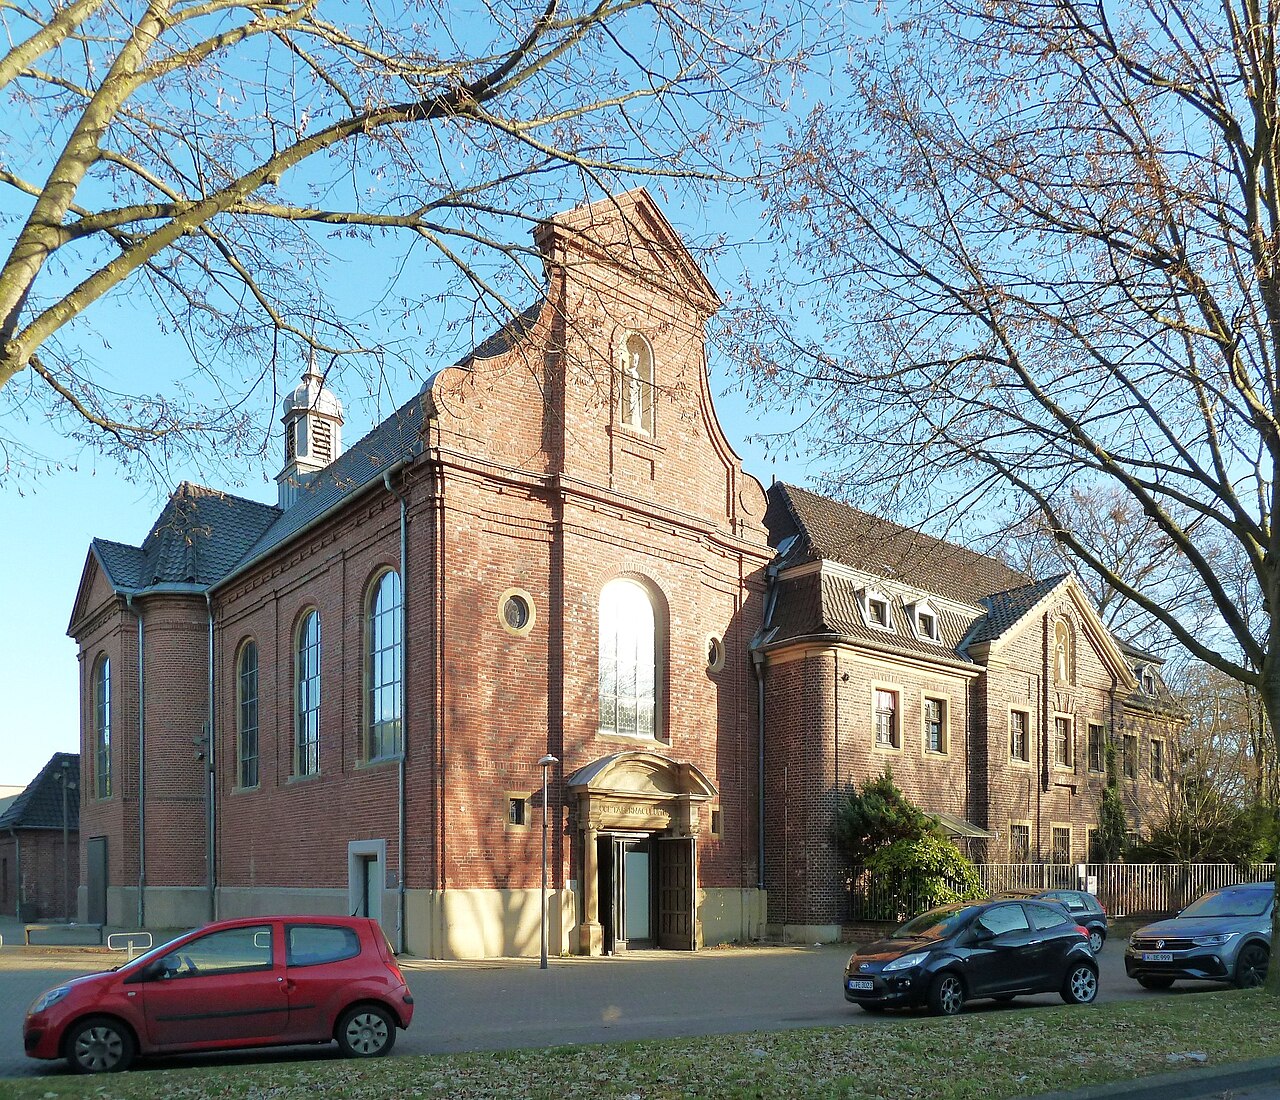
Sources: Cologne neighbourhood monitoring, Statistical data catalogue, City of Cologne geoportal and OpenStreetMap contributors (ODbL) (as of 2024)
Comments
- Loading comments…
Sources & links
- geoportal.stadt-koeln.de (retrieved 2026-06-30)
- Wikipedia (retrieved 2026-06-30)
- openstreetmap.org
How this page is made
This page draws on open sources — Wikipedia, Wikidata, official websites and the city’s open data. Every statement is checked against the sources linked here, and pages are refreshed regularly.
Spotted a mistake anyway? Tell us below — we read every submission.