District
Kalk
Part of borough Kalk
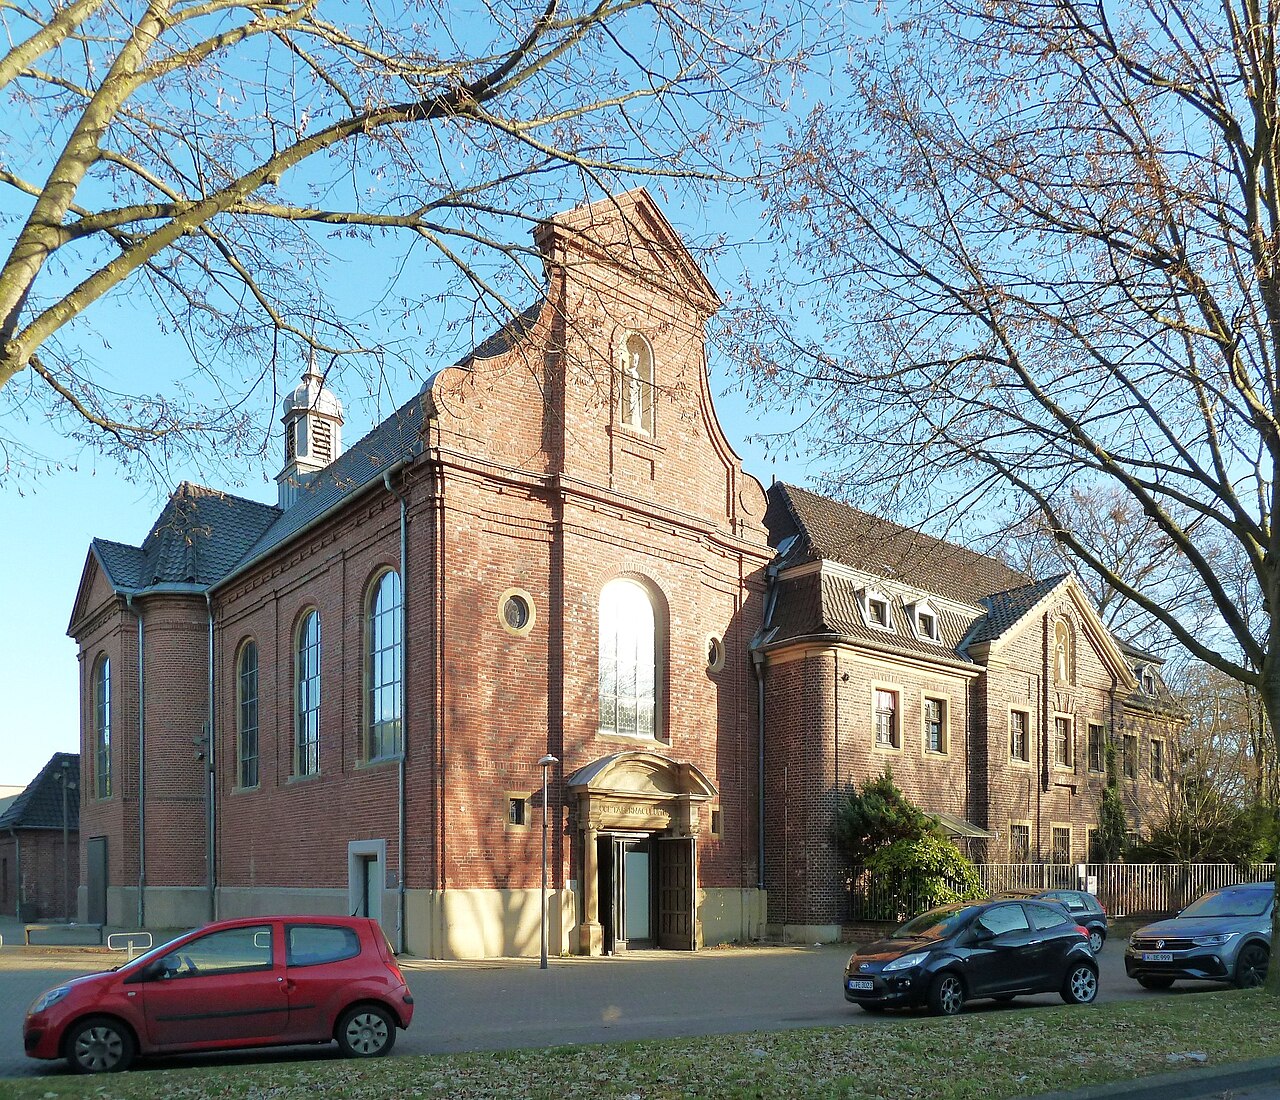
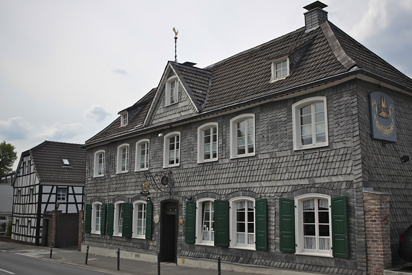
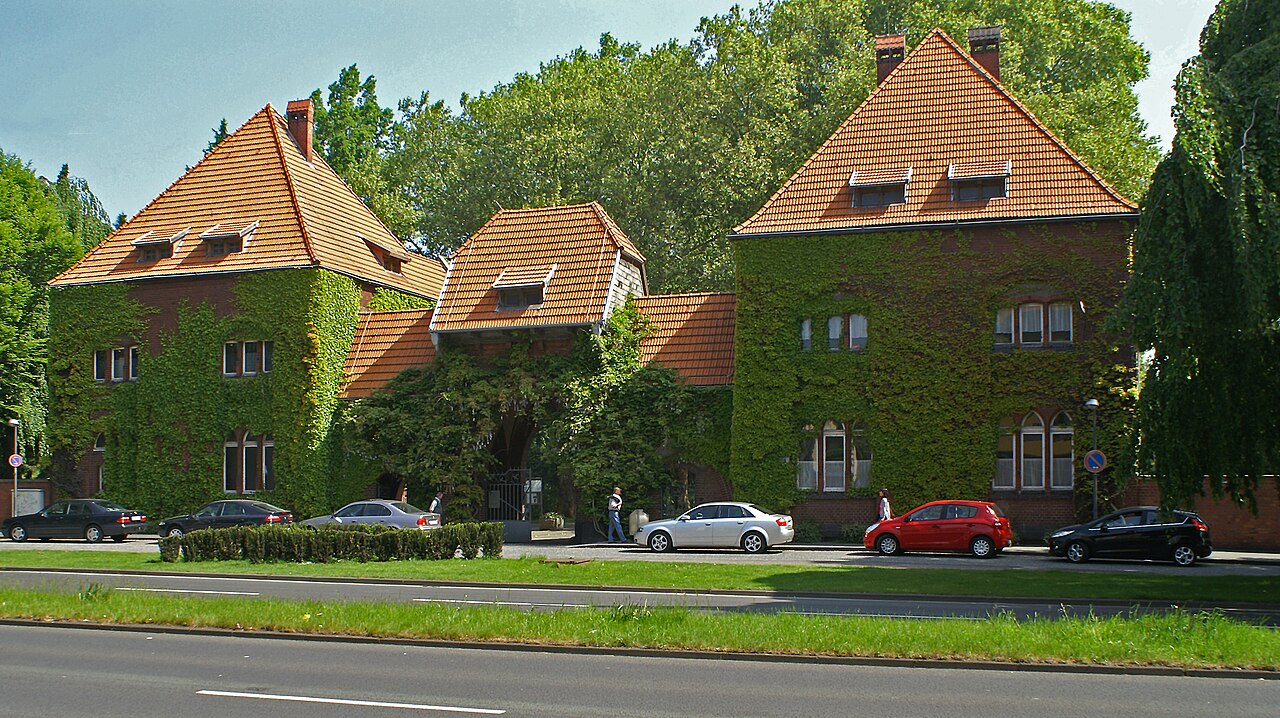
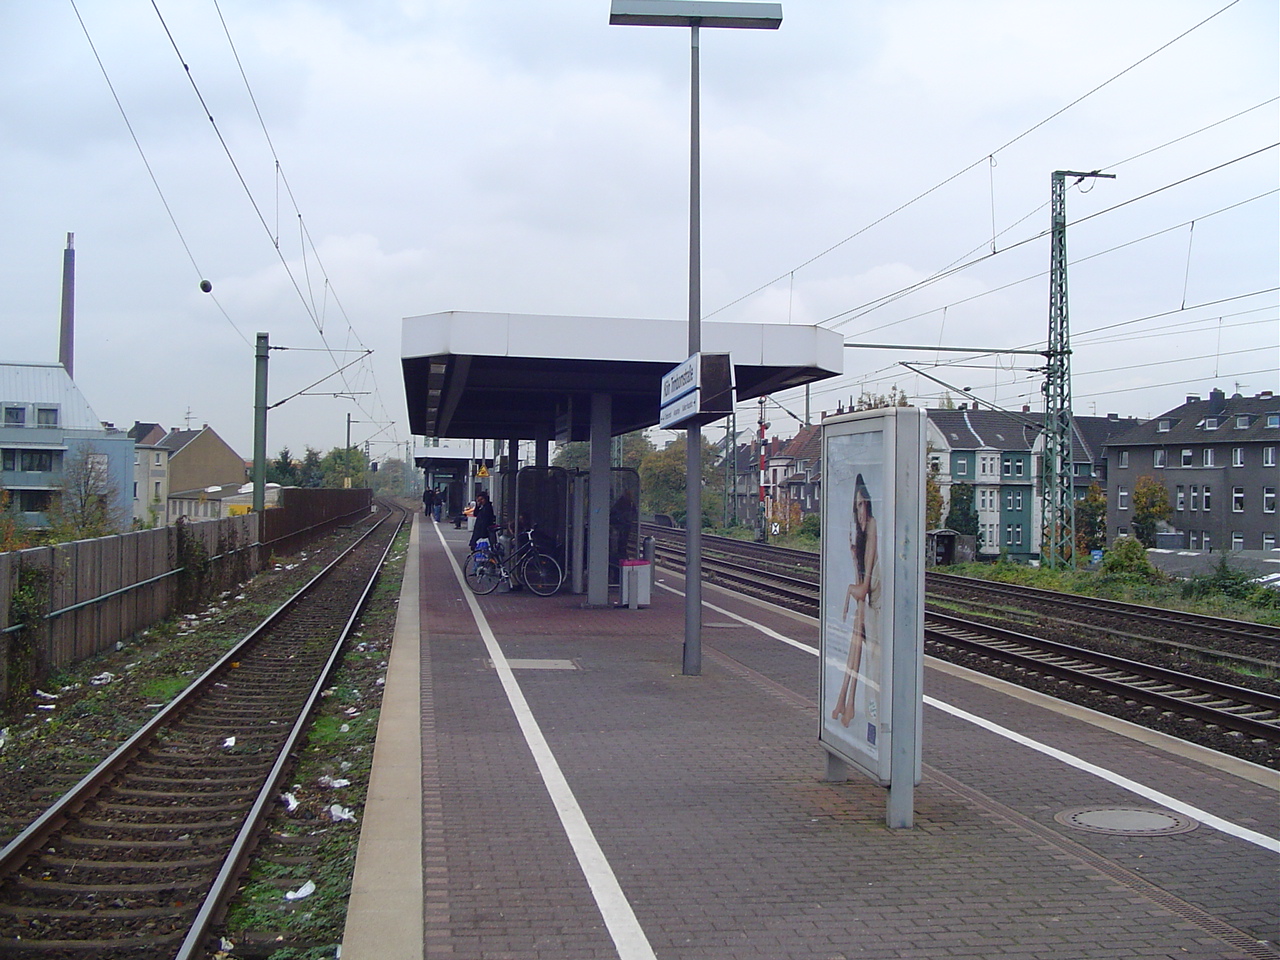
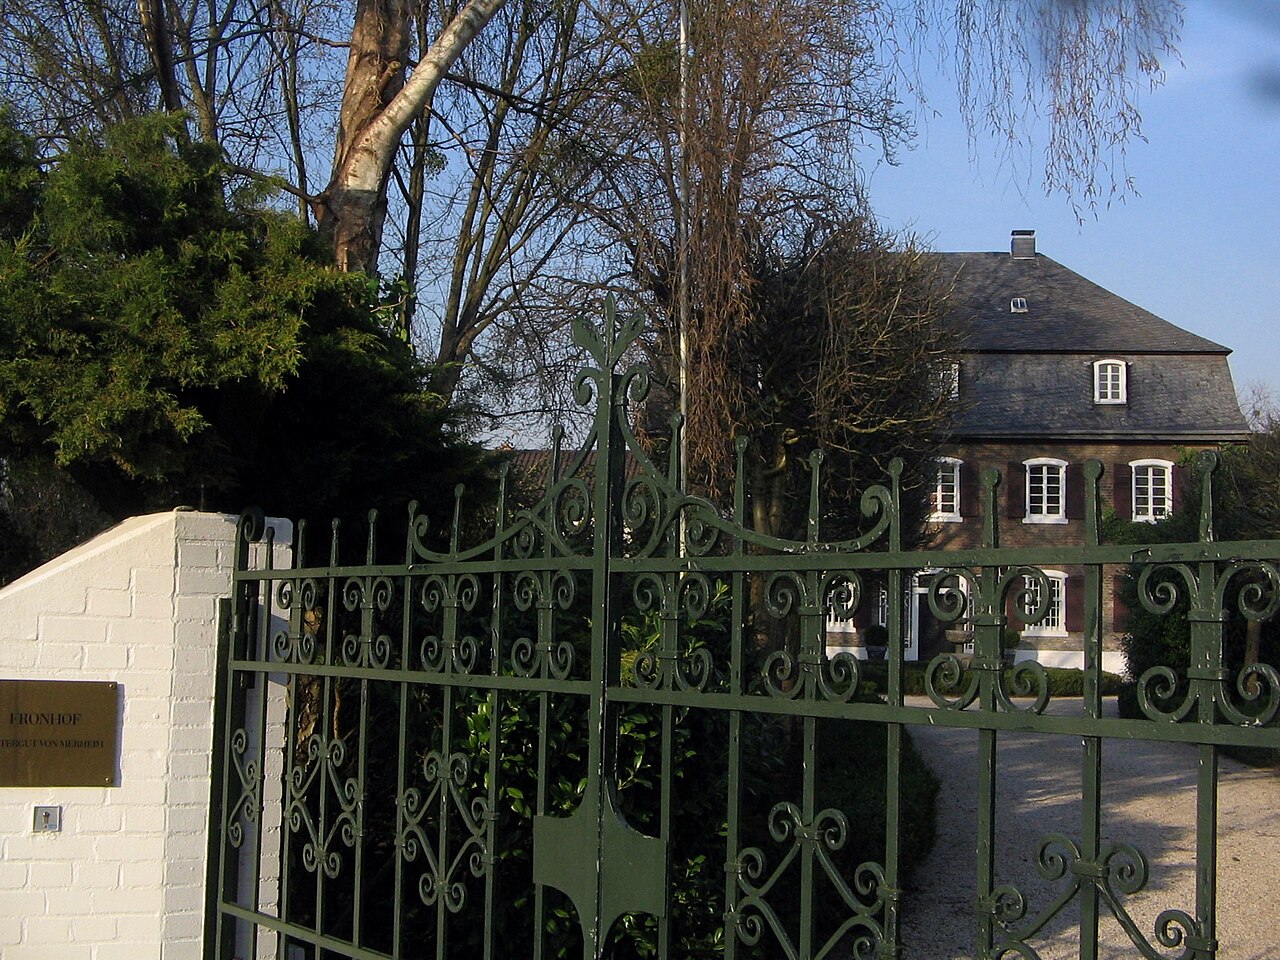
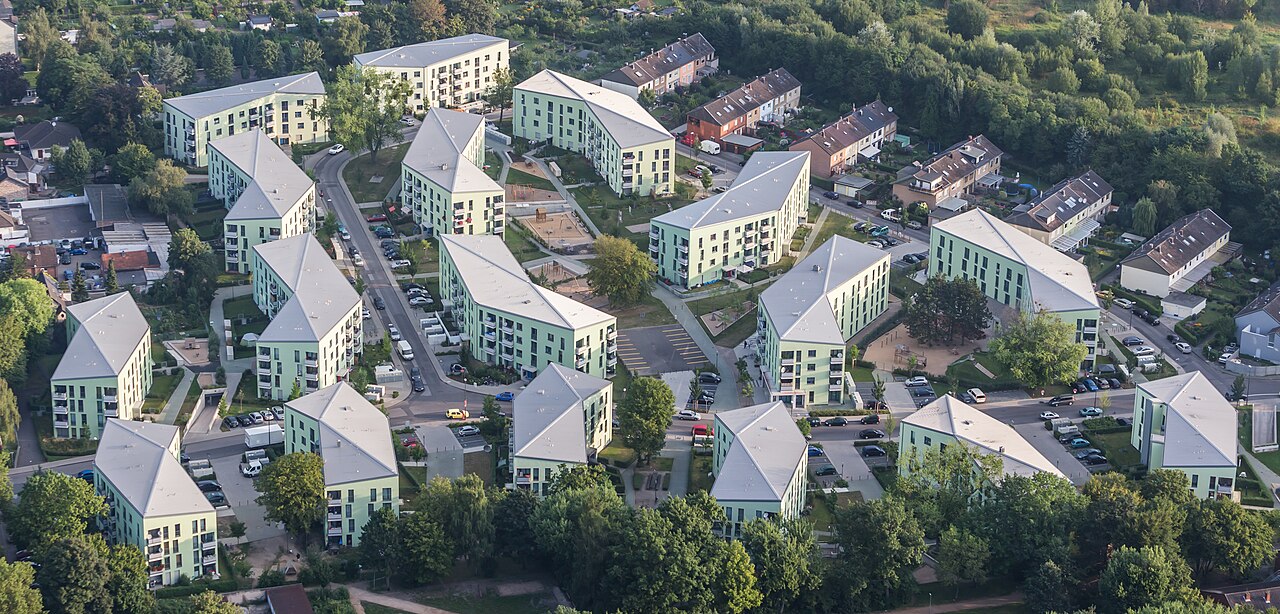
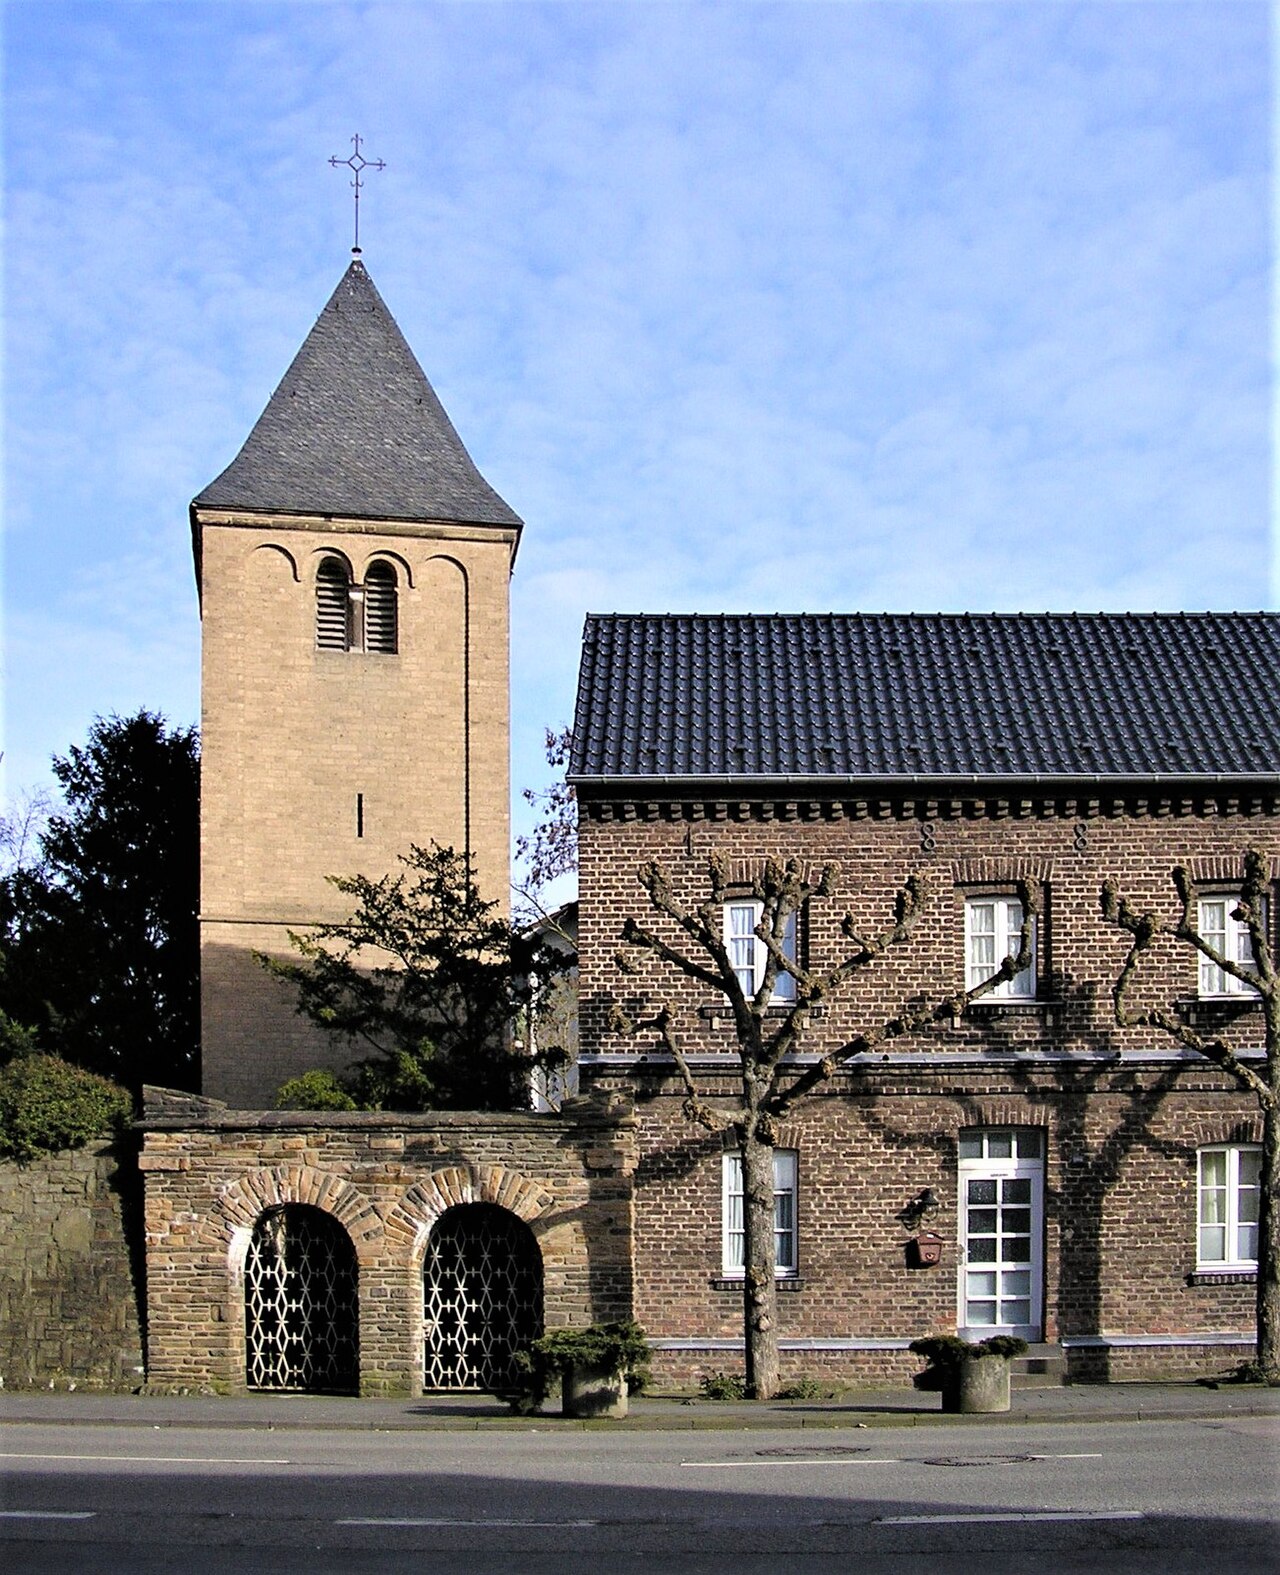
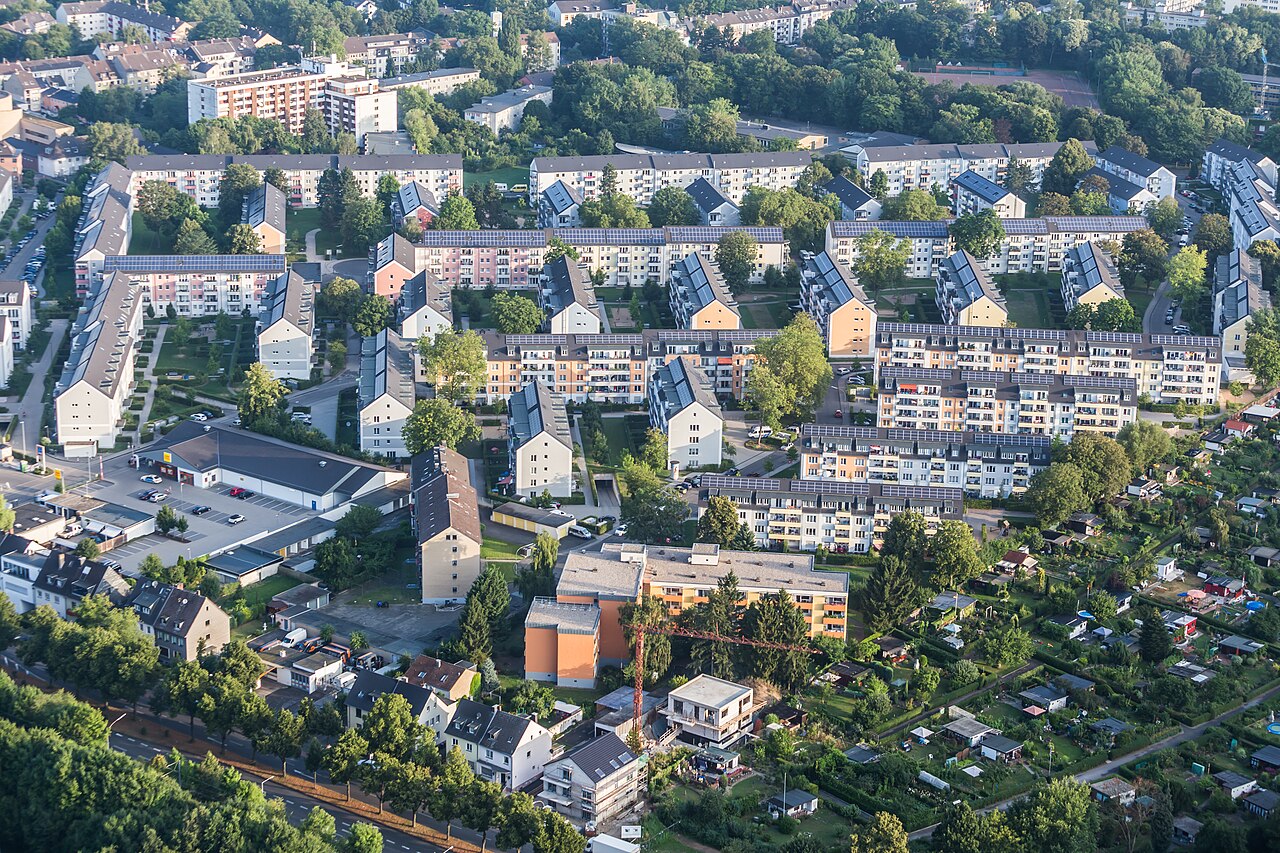
Kalk is a district on the right bank of the Rhine and gives its name to Cologne's Stadtbezirk 8. Once just a handful of farmsteads and a pilgrimage chapel, it grew into a prosperous industrial town through the industrialisation of the mid-19th century and was incorporated into Cologne in 1910. Almost completely destroyed in the Second World War and quickly rebuilt, Kalk remained one of the city's major industrial centres for decades, until factory closures from the 1970s onwards triggered a shift towards housing and administration. Today it is shaped by a large immigrant population and a multicultural community, along with a mix of period buildings, plain post-war apartment blocks, industrial monuments and extensive former industrial sites.
Source: Wikipedia
Each bar shows the share relative to the highest value among 86 districts; the line marks the Cologne average.
Compare with borough & neighbouring districts
Tick areas — their values appear as coloured markers on the bars below.
Age structure
Source: Cologne neighbourhood monitoring
Population & social
Source: Cologne neighbourhood monitoring
Households
Source: Cologne neighbourhood monitoring
Land use
Source: Cologne neighbourhood monitoring
Political leaning
NRW state election 2022, party-list votes — bars relative to the strongest result, percentages beside.
Tick areas — their values appear as coloured markers on the bars.
Per 10,000 inhabitants
Counts in the area, relative to population — fairly comparable.
Tick areas — their values appear as coloured markers on the bars.
Family & everyday
Health & mobility
Sources: City of Cologne open data & geoportal (schools, daycare, playgrounds, transit, hospitals, libraries) and OpenStreetMap contributors (ODbL; pharmacies, supermarkets, markets, recycling, fountains, EV charging)
What's in this area
Counted within the boundary from open data — City of Cologne (geoportal/open data) and OpenStreetMap contributors (ODbL). Every number links to its source.
Neighbouring districts
Sources: Cologne neighbourhood monitoring, Statistical data catalogue, City of Cologne geoportal and OpenStreetMap contributors (ODbL) (as of 2024)
Comments
- Loading comments…
Sources & links
- geoportal.stadt-koeln.de (retrieved 2026-06-30)
- Wikipedia (retrieved 2026-06-30)
- Wikipedia (retrieved 2026-06-30)
- openstreetmap.org
How this page is made
This page draws on open sources — Wikipedia, Wikidata, official websites and the city’s open data. Every statement is checked against the sources linked here, and pages are refreshed regularly.
Spotted a mistake anyway? Tell us below — we read every submission.