City borough
Innenstadt
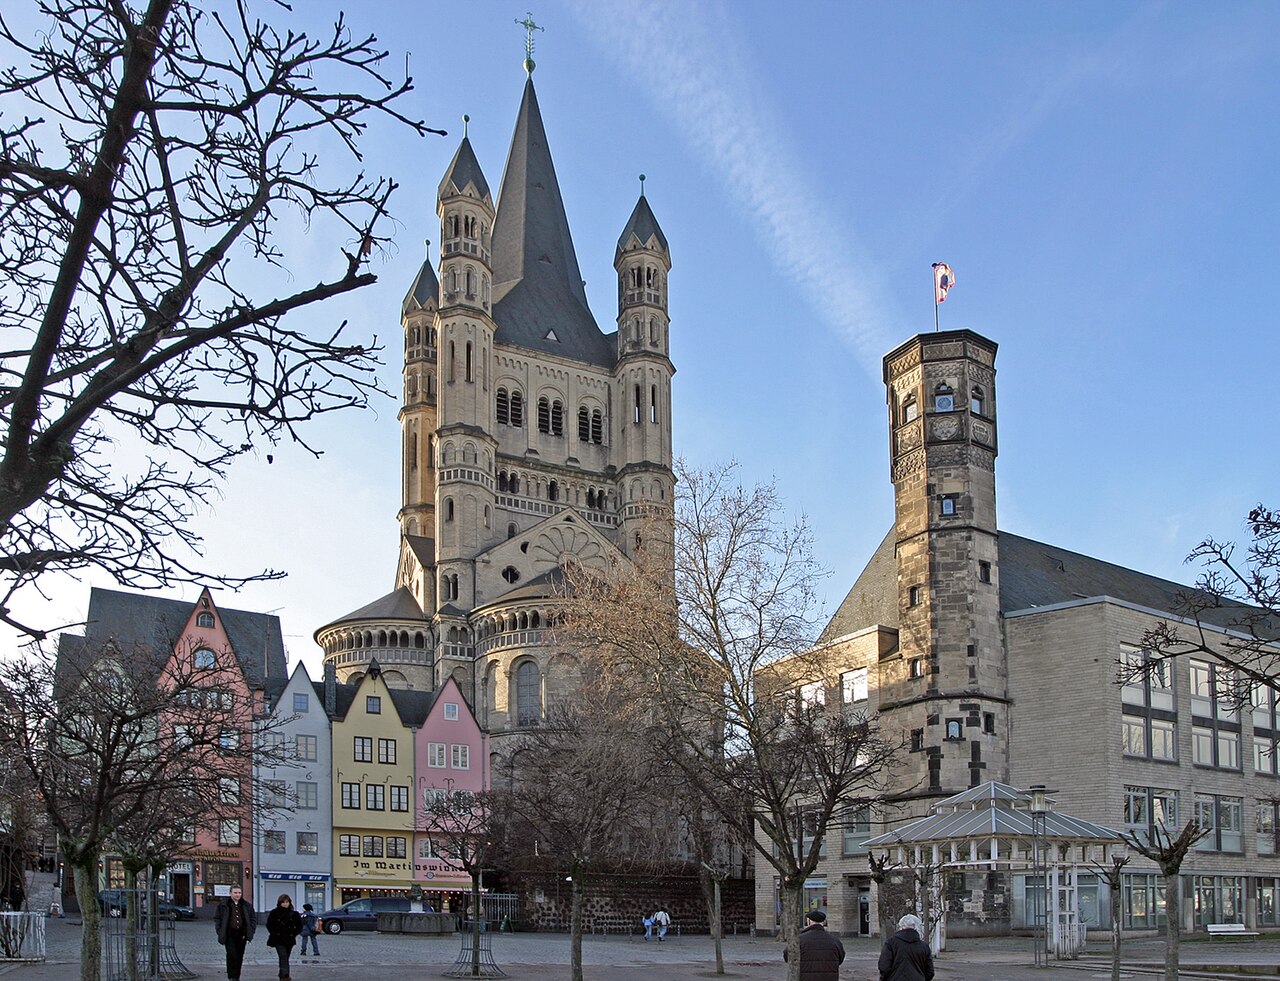
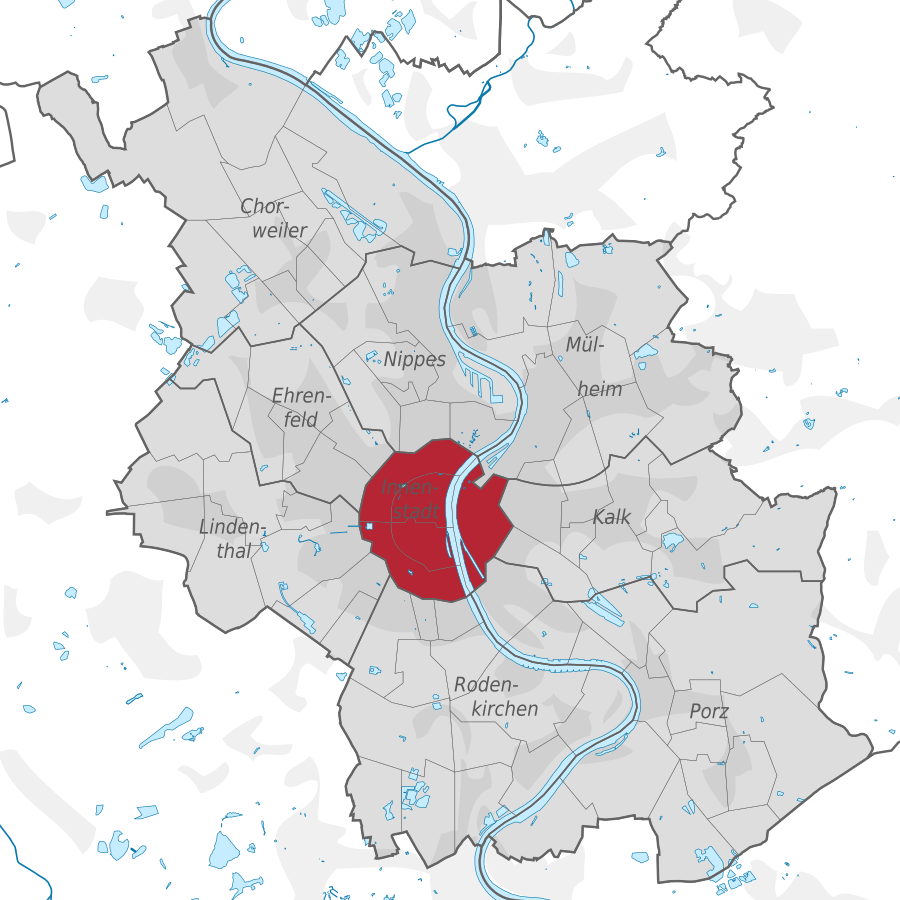
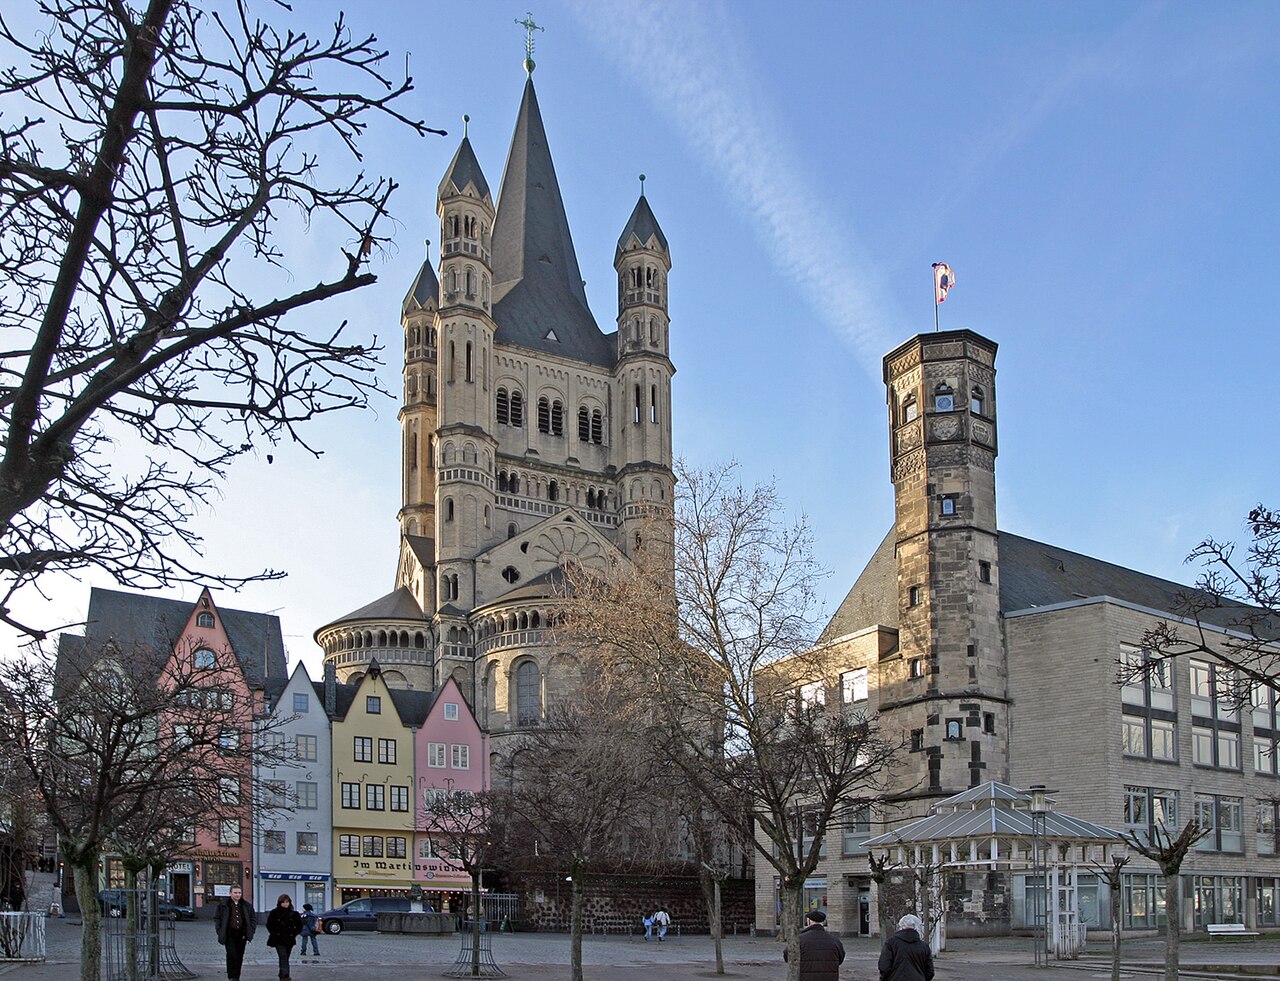
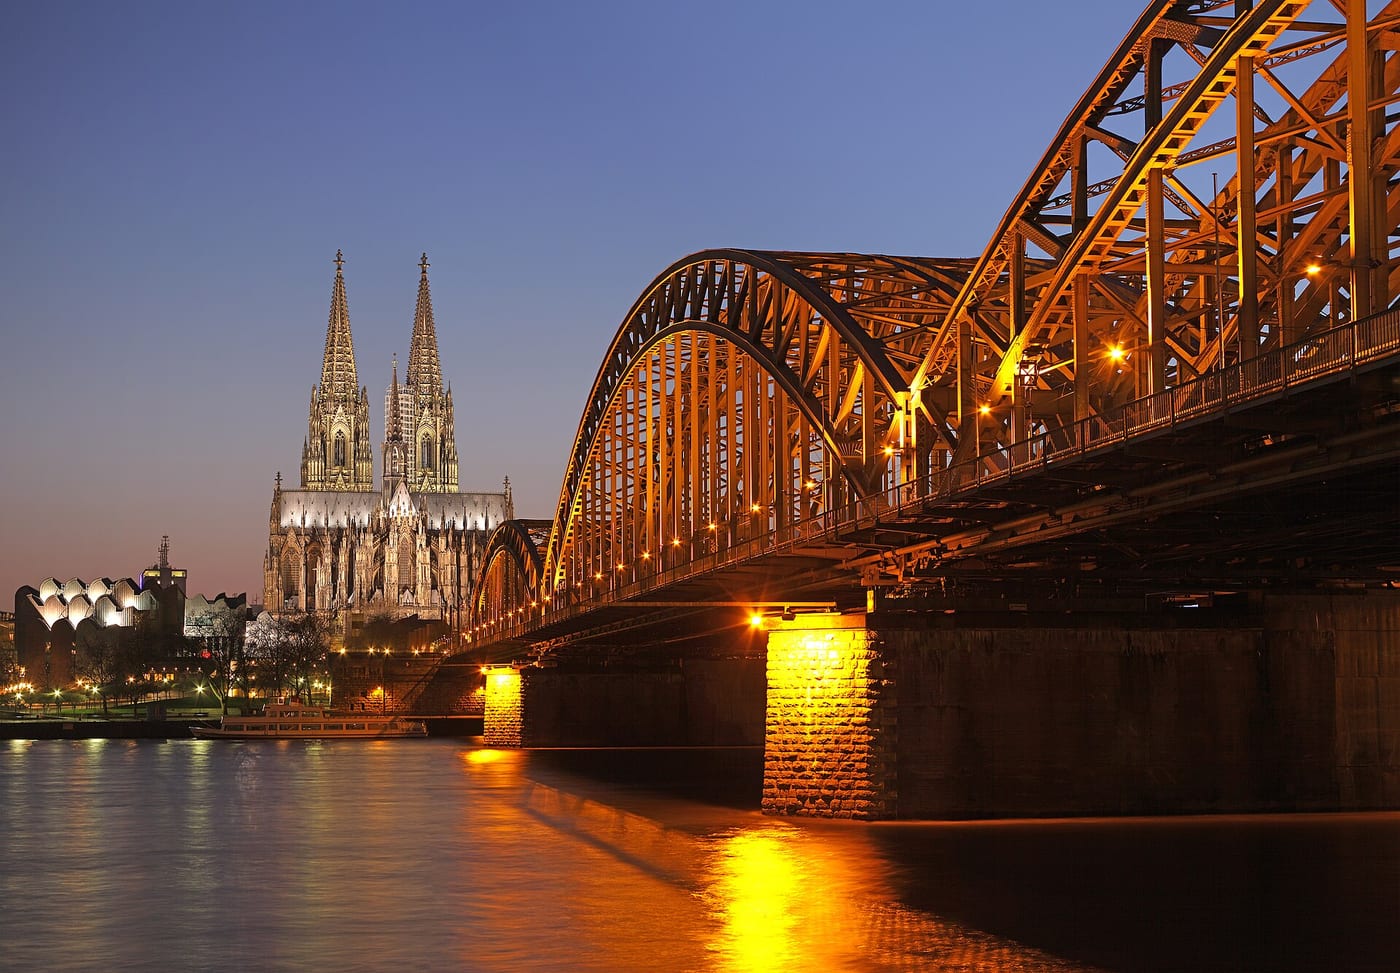
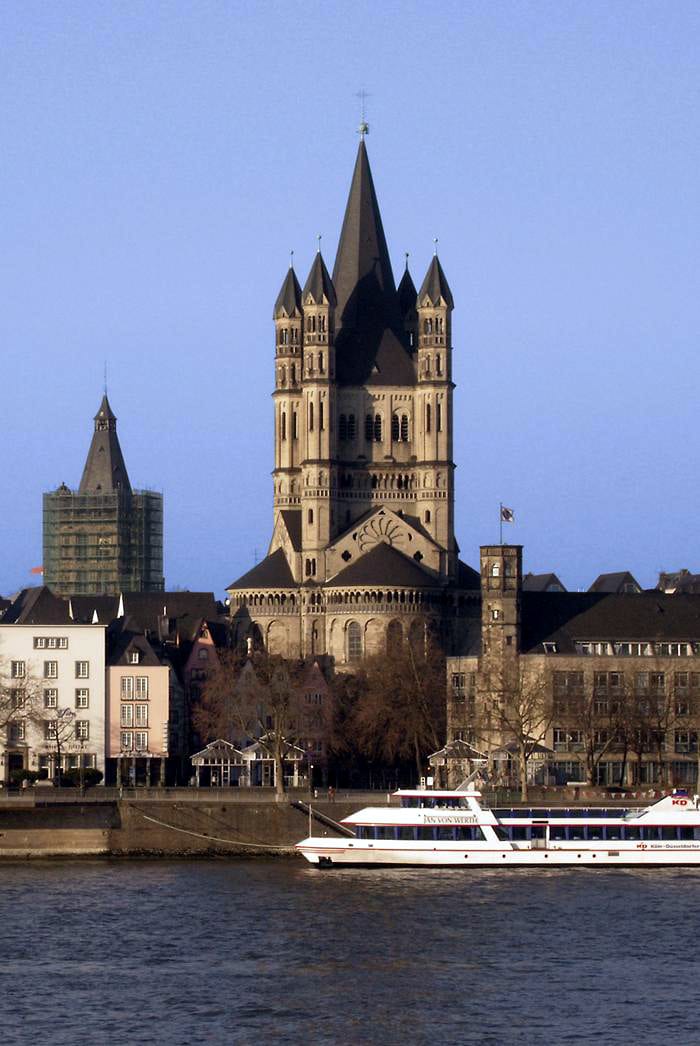
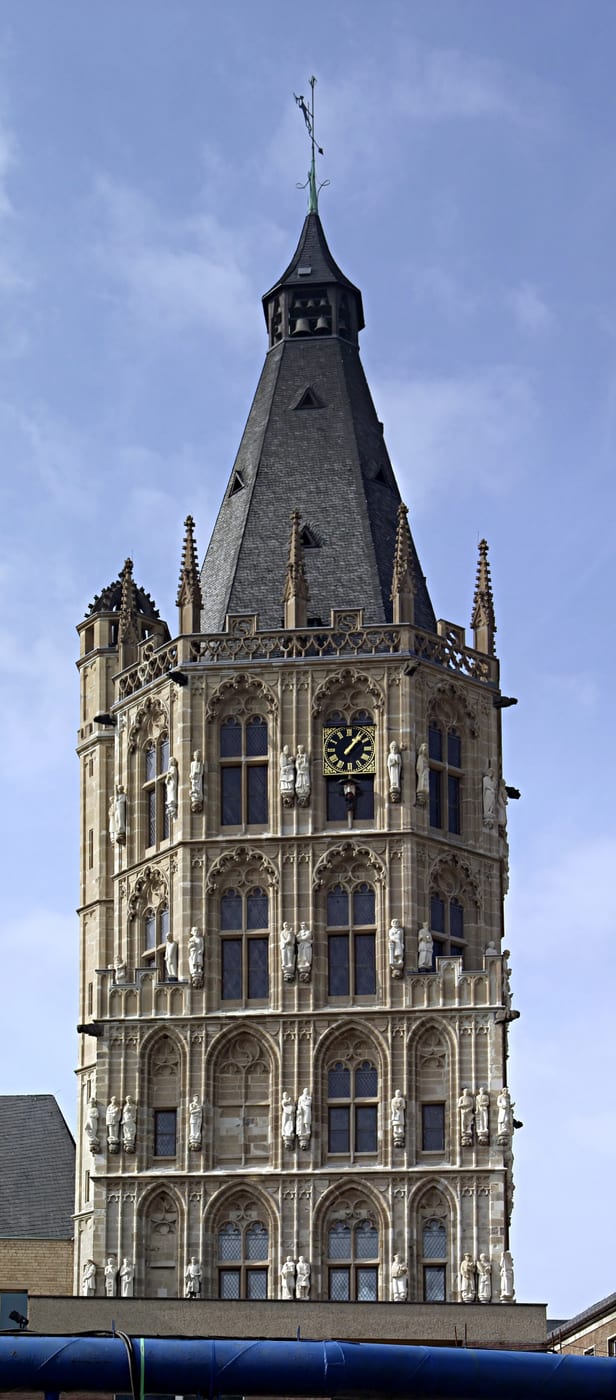
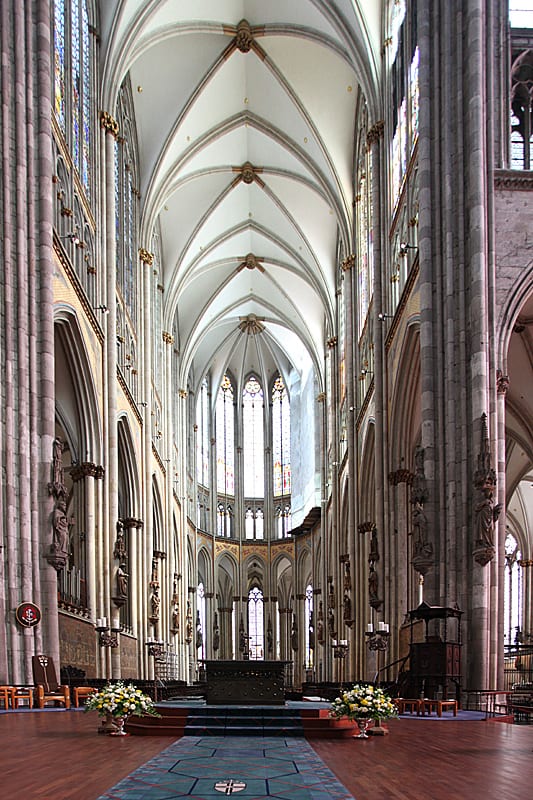
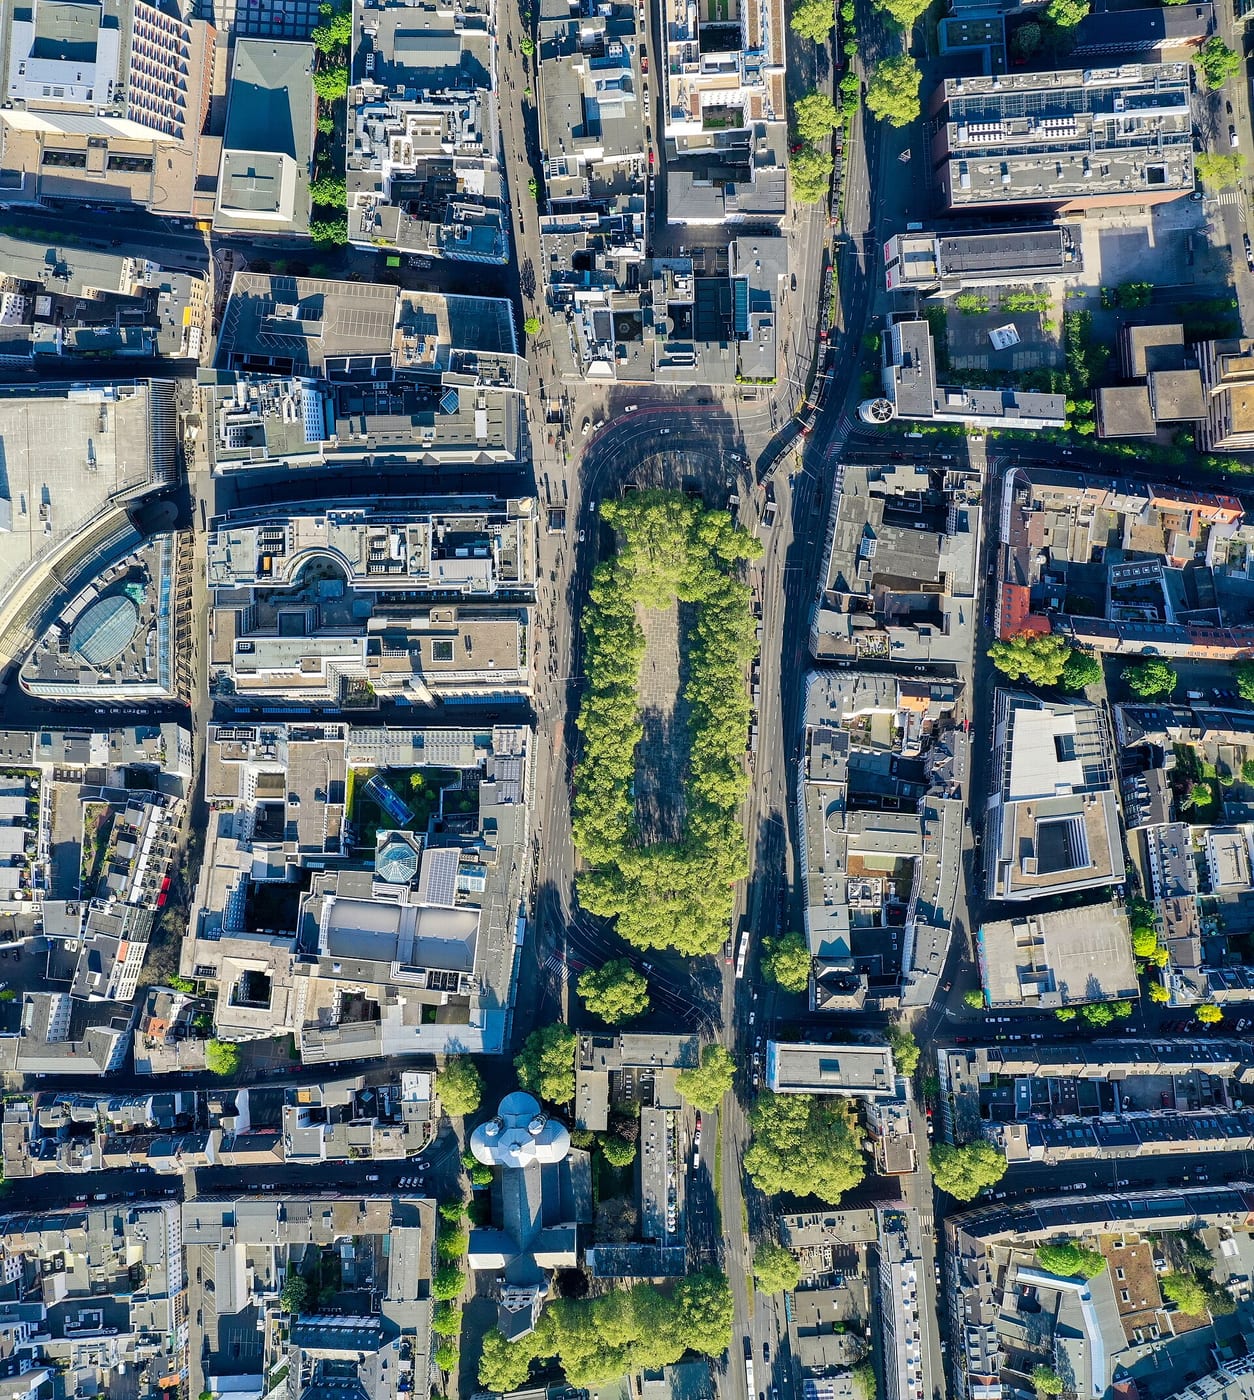
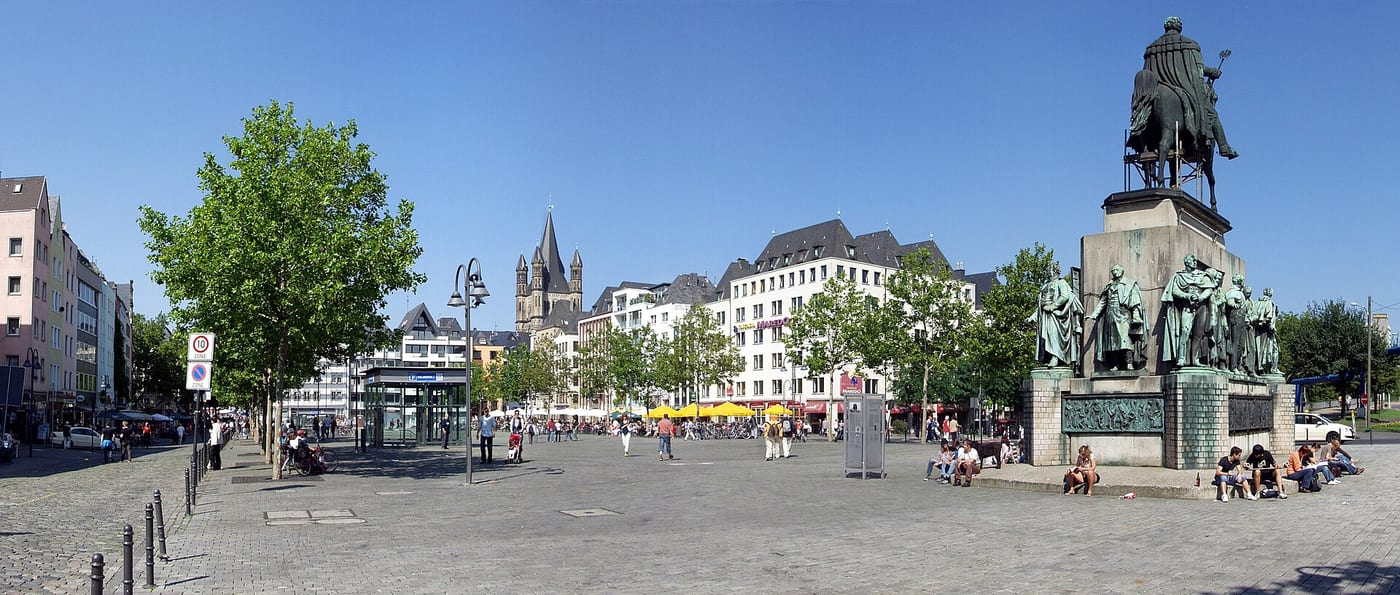
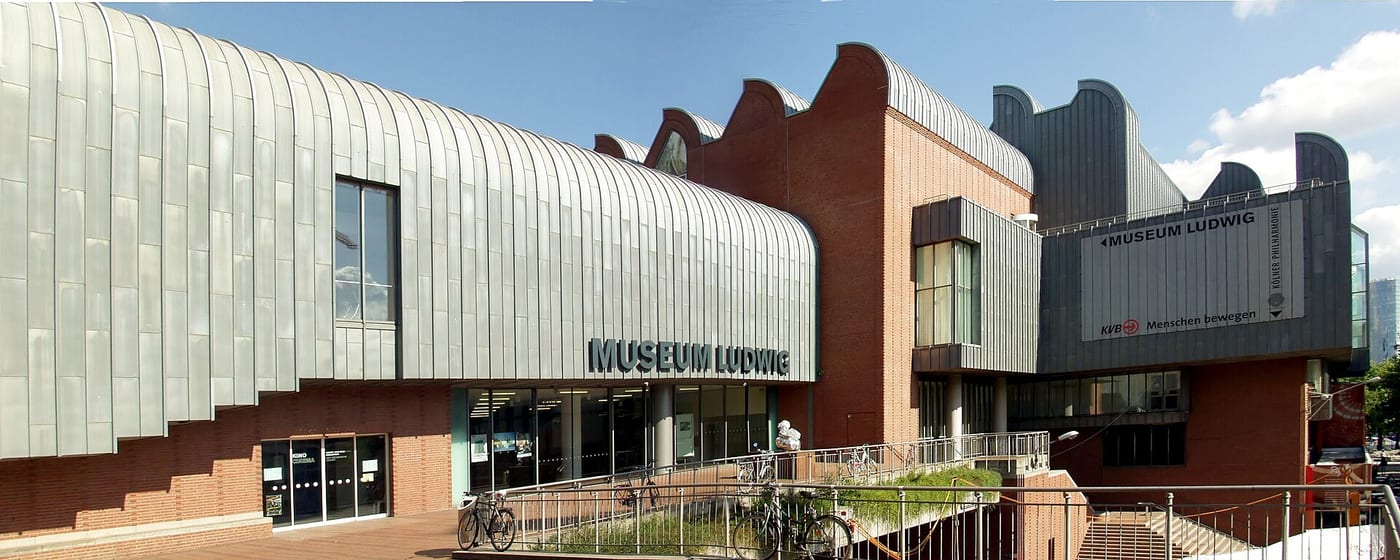
Innenstadt is the first of Cologne's nine boroughs and was established on 1 January 1975 as part of the municipal reorganization. Spanning both banks of the Rhine, it brings together the districts of Altstadt-Nord, Altstadt-Süd, Deutz, Neustadt-Nord and Neustadt-Süd.
Source: Wikipedia
Compare with other boroughs
Tick areas — their values appear as coloured markers on the bars below.
Age structure
Source: Cologne neighbourhood monitoring
Population & social
Source: Cologne neighbourhood monitoring
Households
Source: Cologne neighbourhood monitoring
Land use
Source: Cologne neighbourhood monitoring
Political leaning
NRW state election 2022, party-list votes — bars relative to the strongest result, percentages beside.
Tick areas — their values appear as coloured markers on the bars.
Per 10,000 inhabitants
Counts in the area, relative to population — fairly comparable.
Tick areas — their values appear as coloured markers on the bars.
Family & everyday
Health & mobility
Sources: City of Cologne open data & geoportal (schools, daycare, playgrounds, transit, hospitals, libraries) and OpenStreetMap contributors (ODbL; pharmacies, supermarkets, markets, recycling, fountains, EV charging)
What's in this area
Counted within the boundary from open data — City of Cologne (geoportal/open data) and OpenStreetMap contributors (ODbL). Every number links to its source.
Districts in this borough
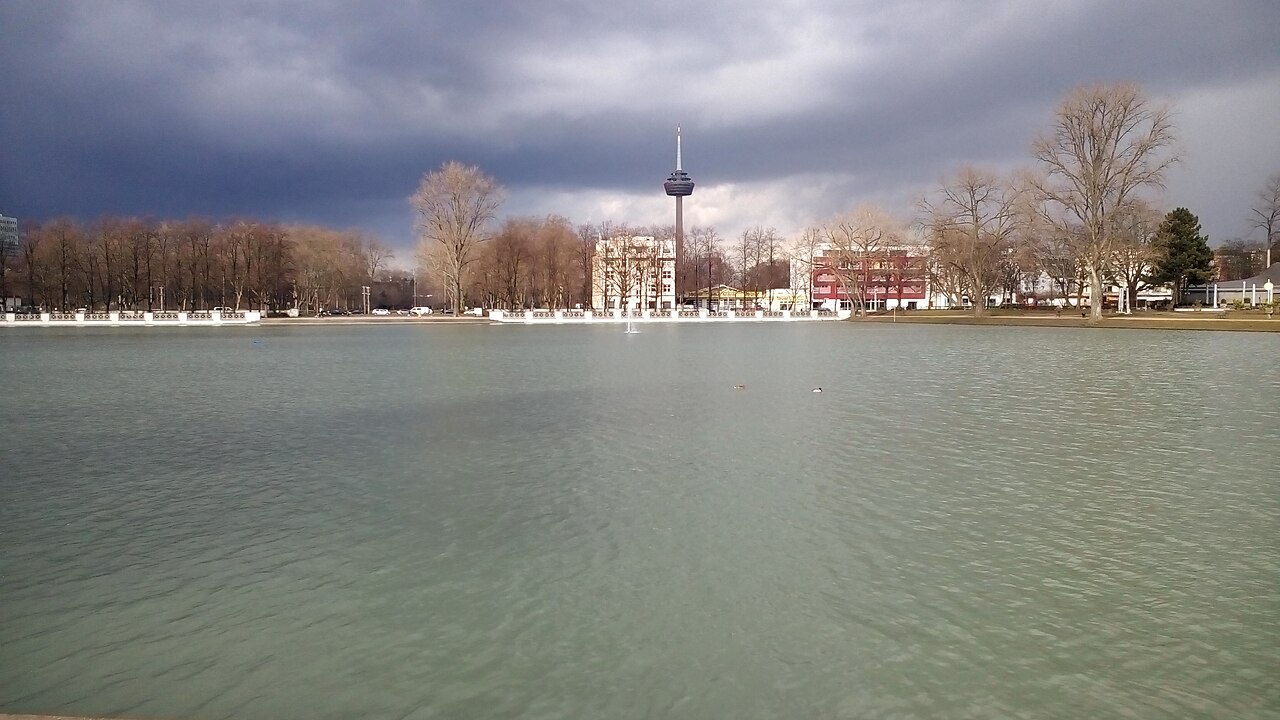
Neustadt-Süd is part of Cologne's Innenstadt district and has the highest population density of any quarter in the city. Originally a Gründerzeit neighbourhood, it was heavily damaged during the …

Neustadt-Nord sits in the centre of Cologne, just northwest of the Old Town, and belongs to the Innenstadt district. Once a typical Gründerzeit quarter, it was heavily damaged during the Second World …
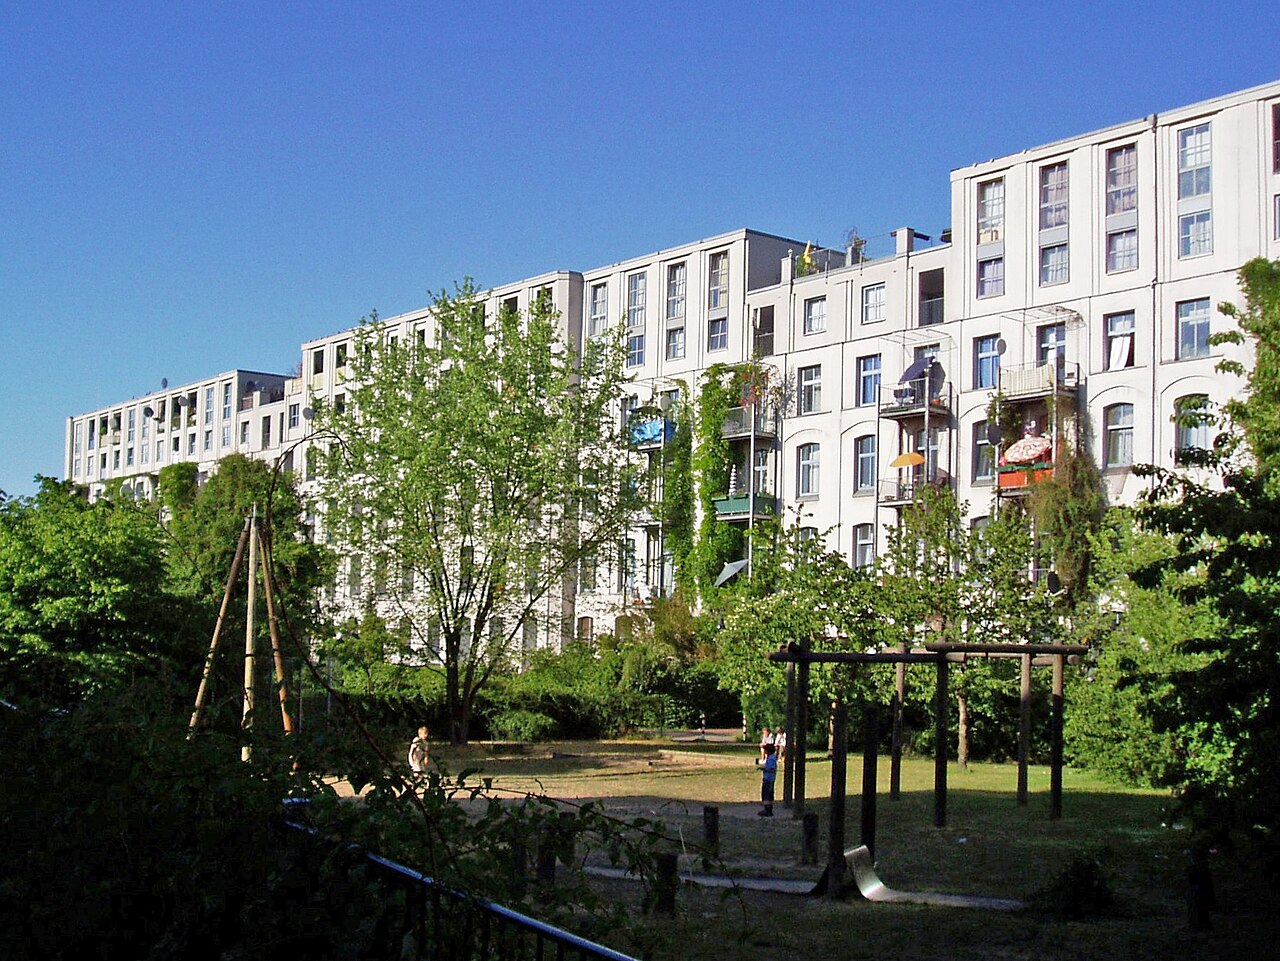
Altstadt-Süd makes up the southern part of Cologne's historic city centre and belongs to the Innenstadt district. Until 1881 the area was enclosed by the medieval city wall, of which the Hahnentor, …
The other boroughs
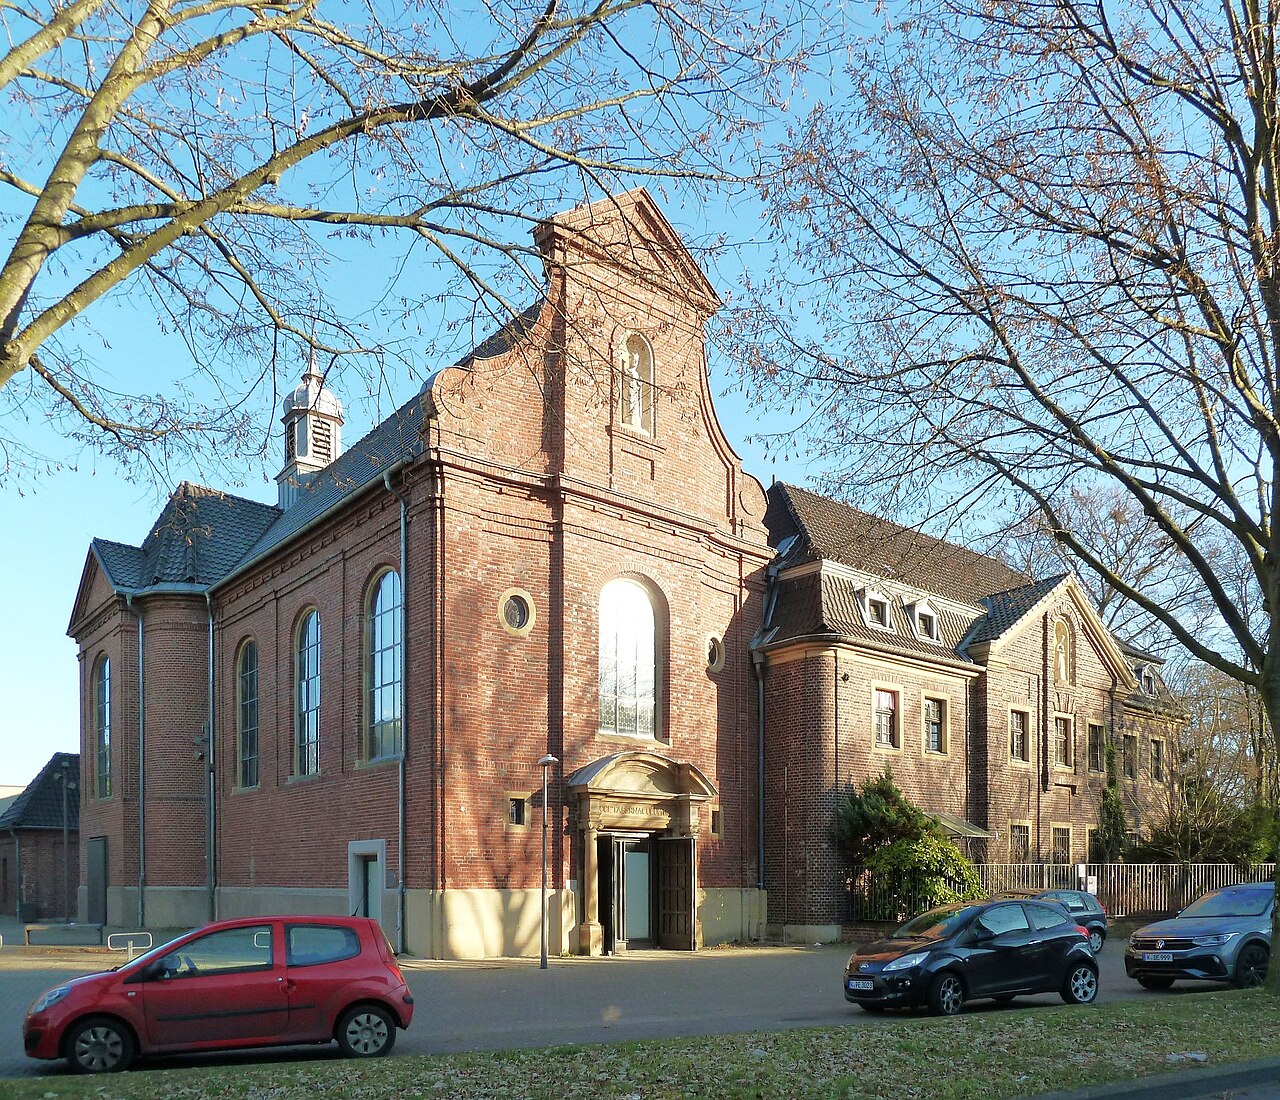
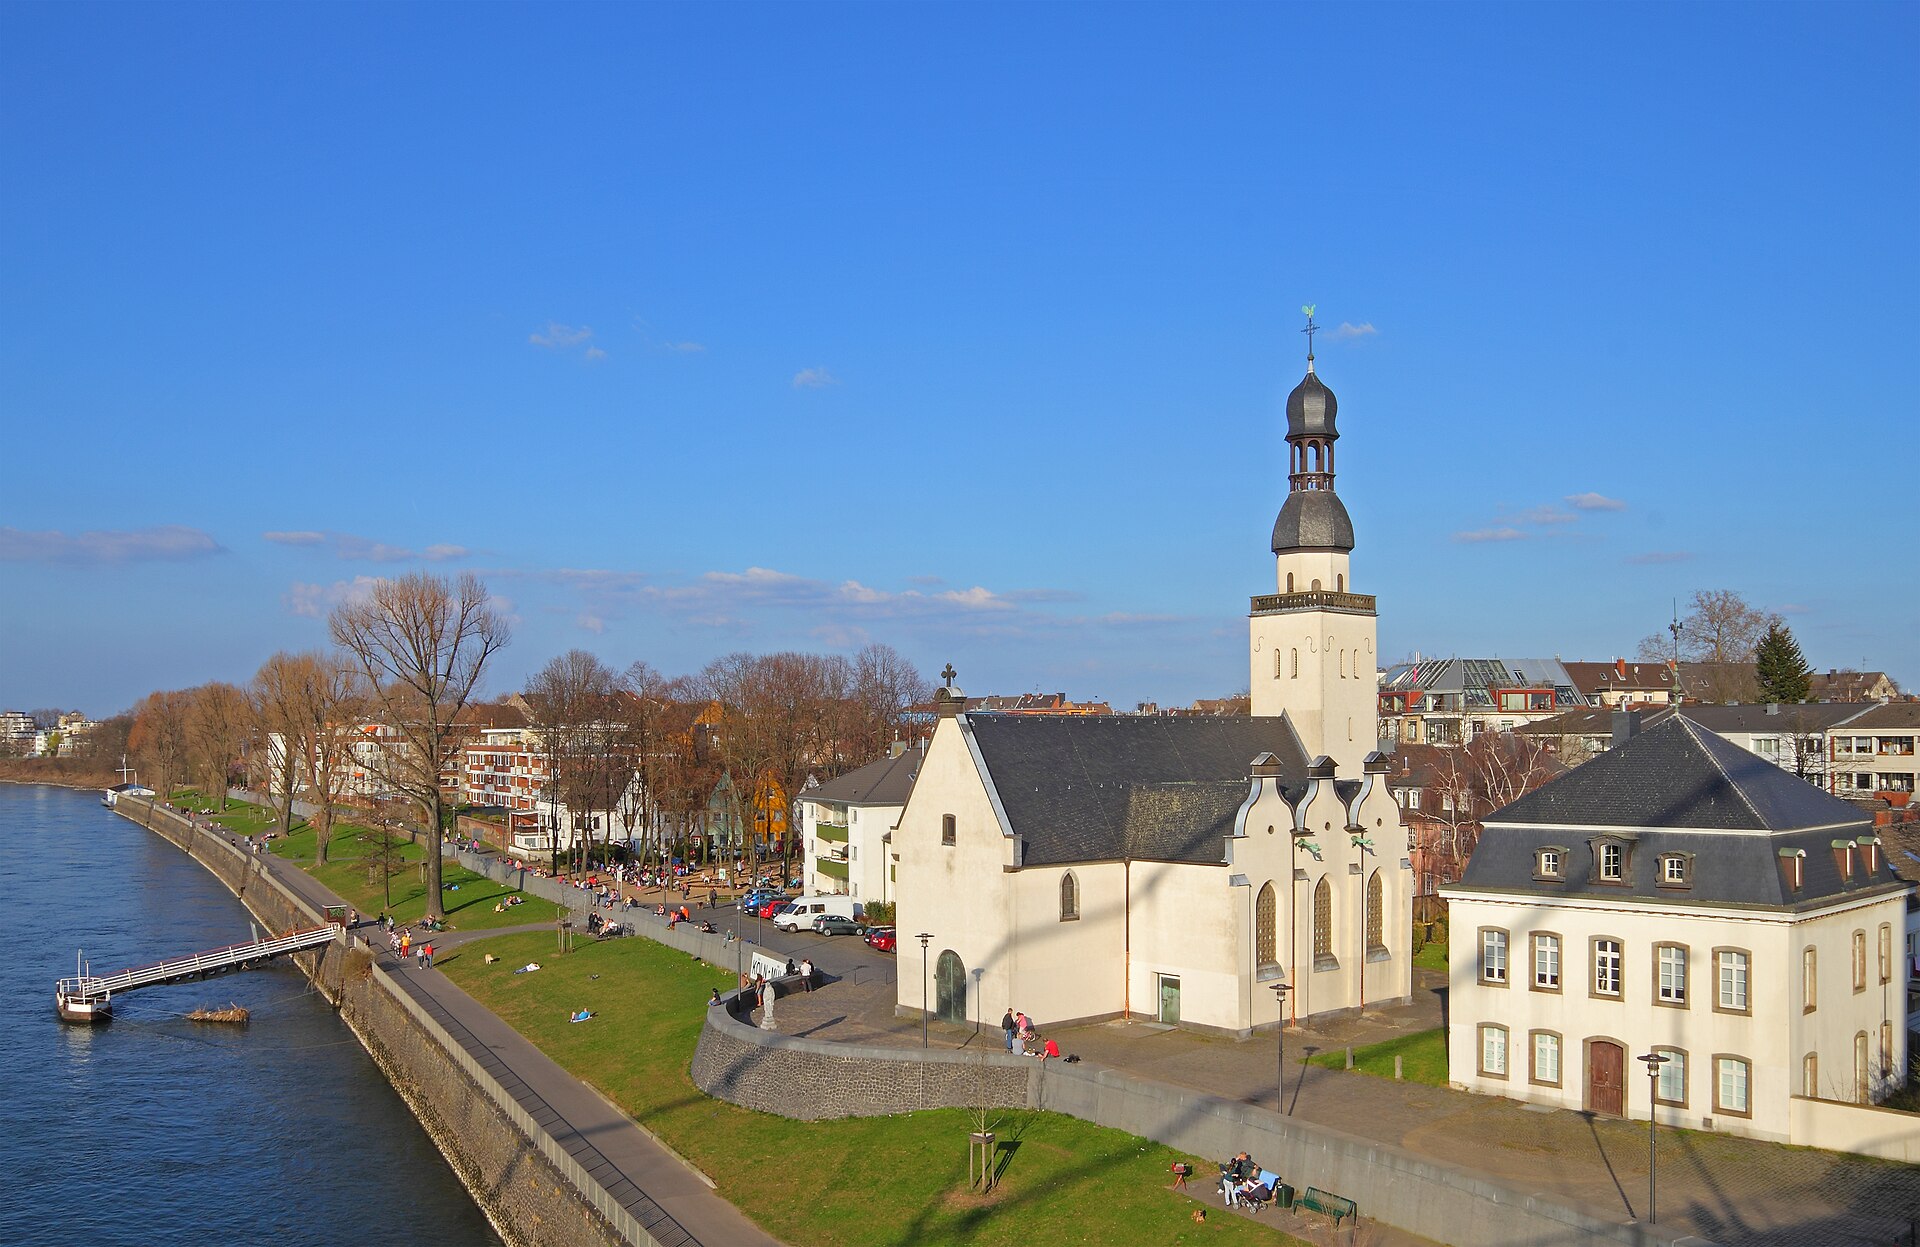
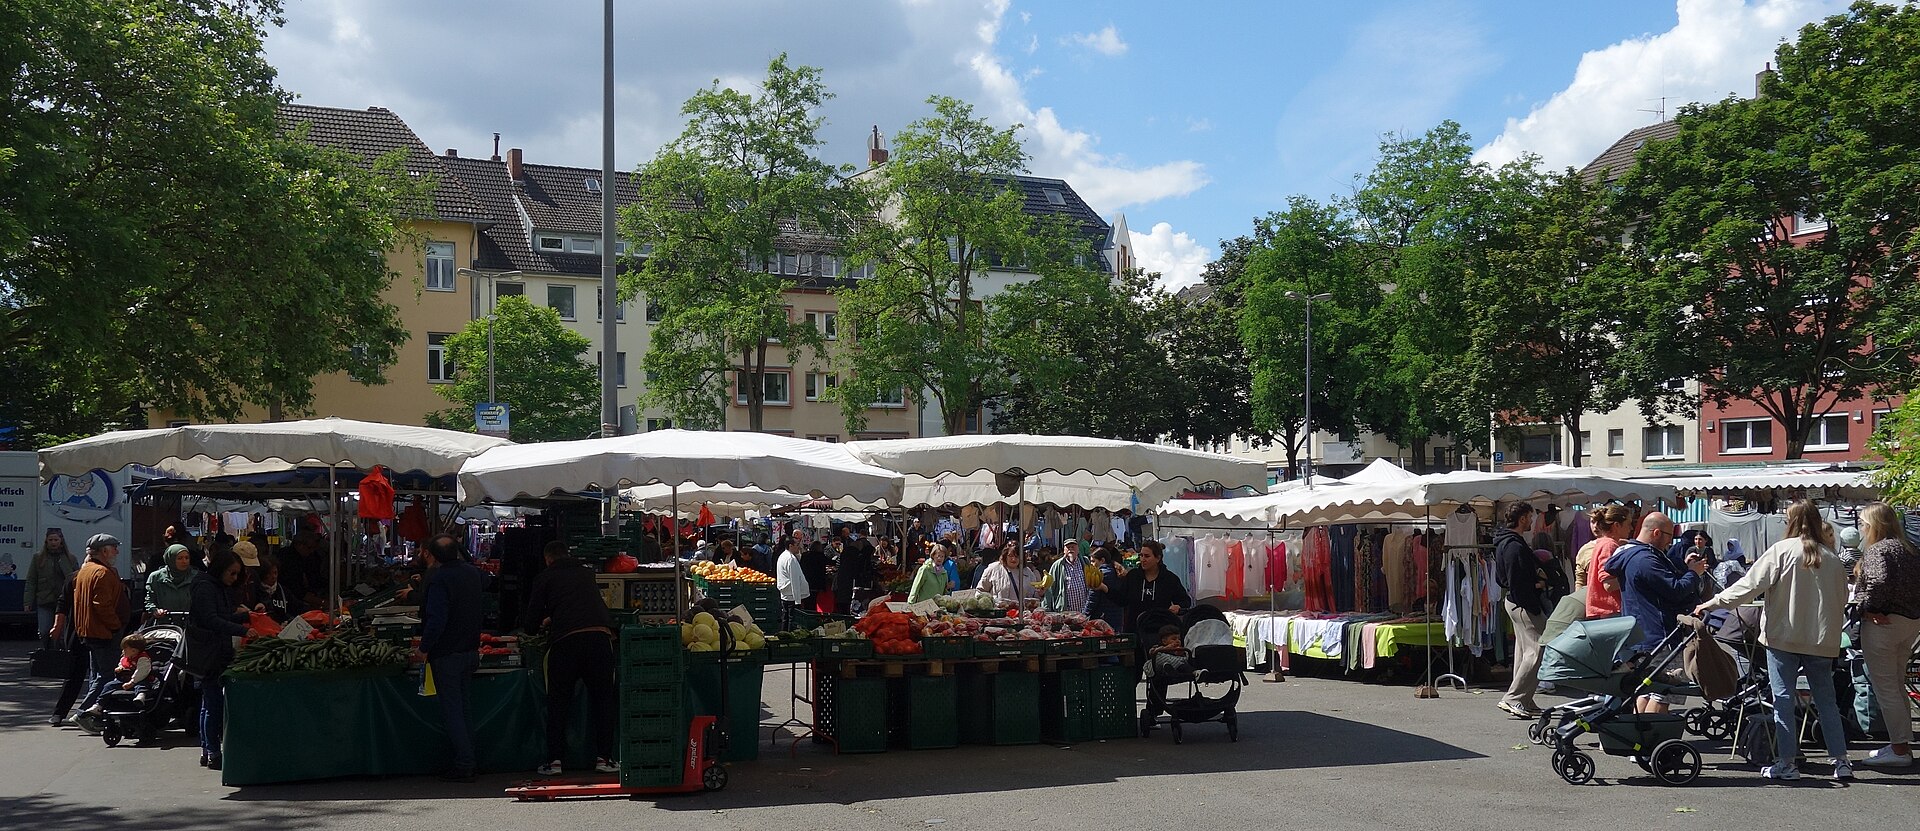
Sources: Cologne neighbourhood monitoring, Statistical data catalogue, City of Cologne geoportal and OpenStreetMap contributors (ODbL) (as of 2024)
Comments
- Loading comments…
Sources & links
- geoportal.stadt-koeln.de (retrieved 2026-06-30)
- Wikipedia (retrieved 2026-06-30)
- Wikipedia (retrieved 2026-06-30)
- openstreetmap.org
How this page is made
This page draws on open sources — Wikipedia, Wikidata, official websites and the city’s open data. Every statement is checked against the sources linked here, and pages are refreshed regularly.
Spotted a mistake anyway? Tell us below — we read every submission.