Skip to content
stuff to do in.cologne

District

Mülheim

Part of borough Mülheim

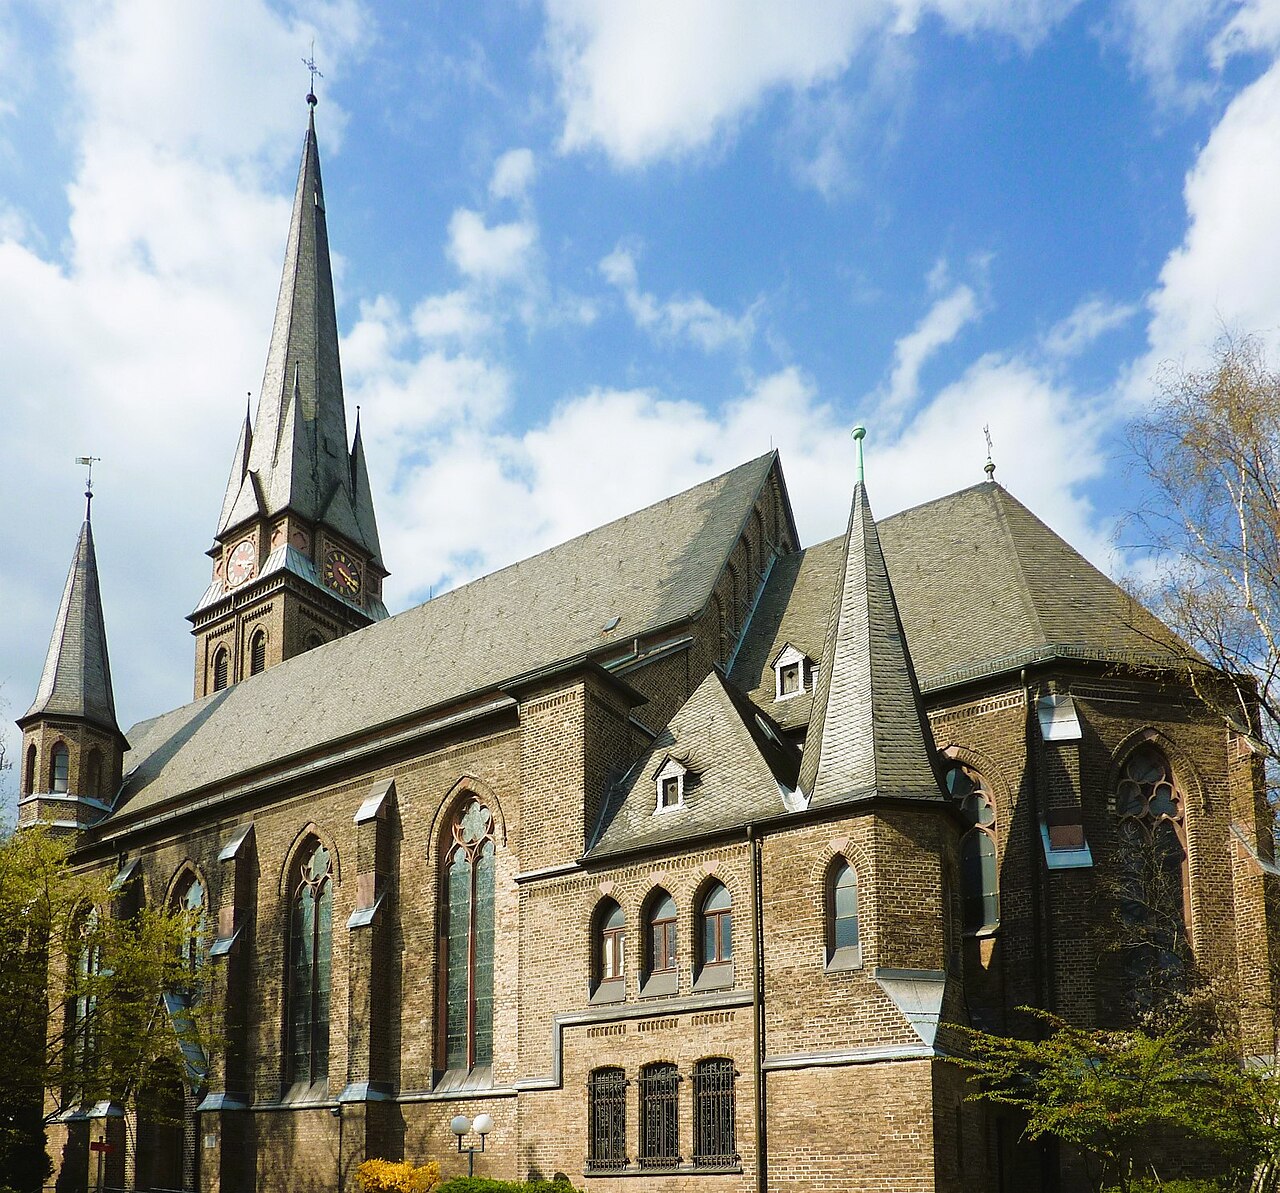
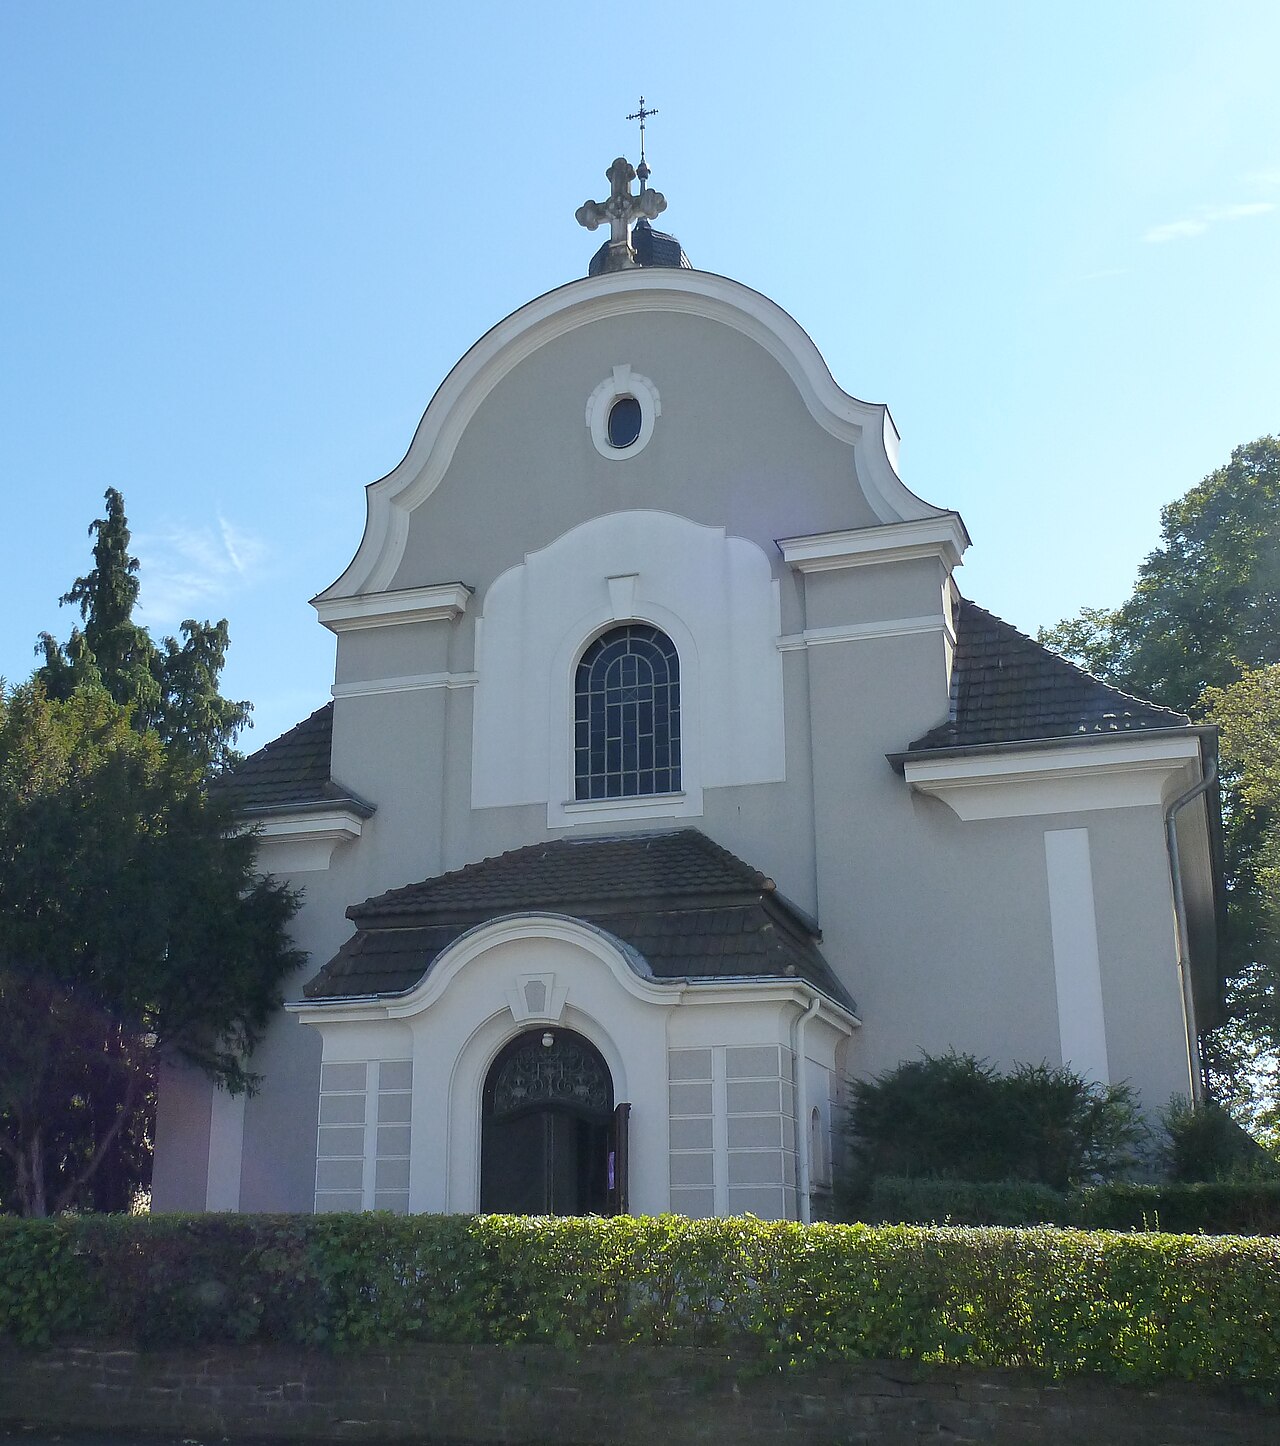
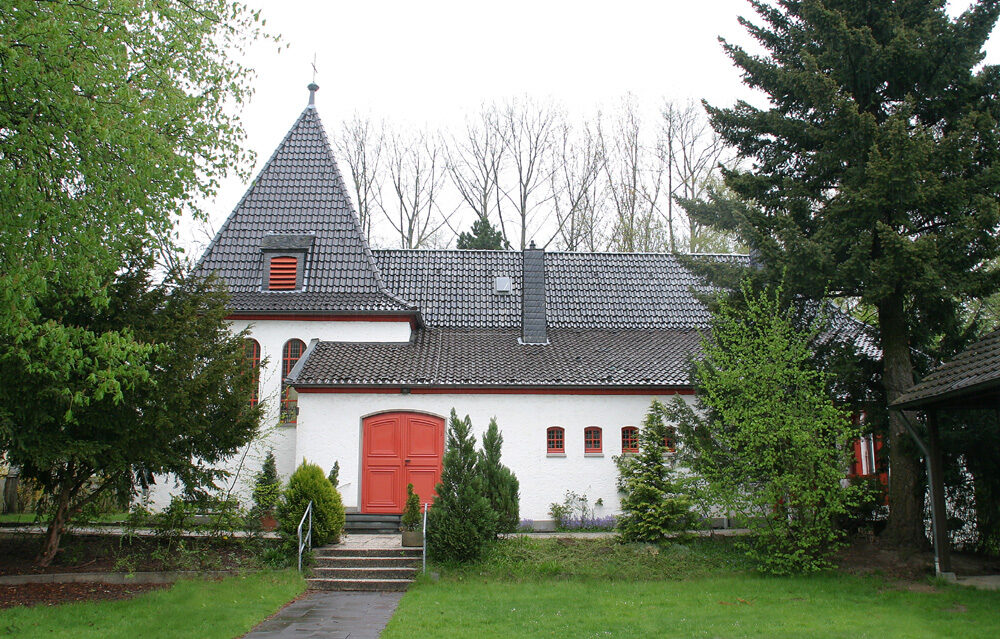
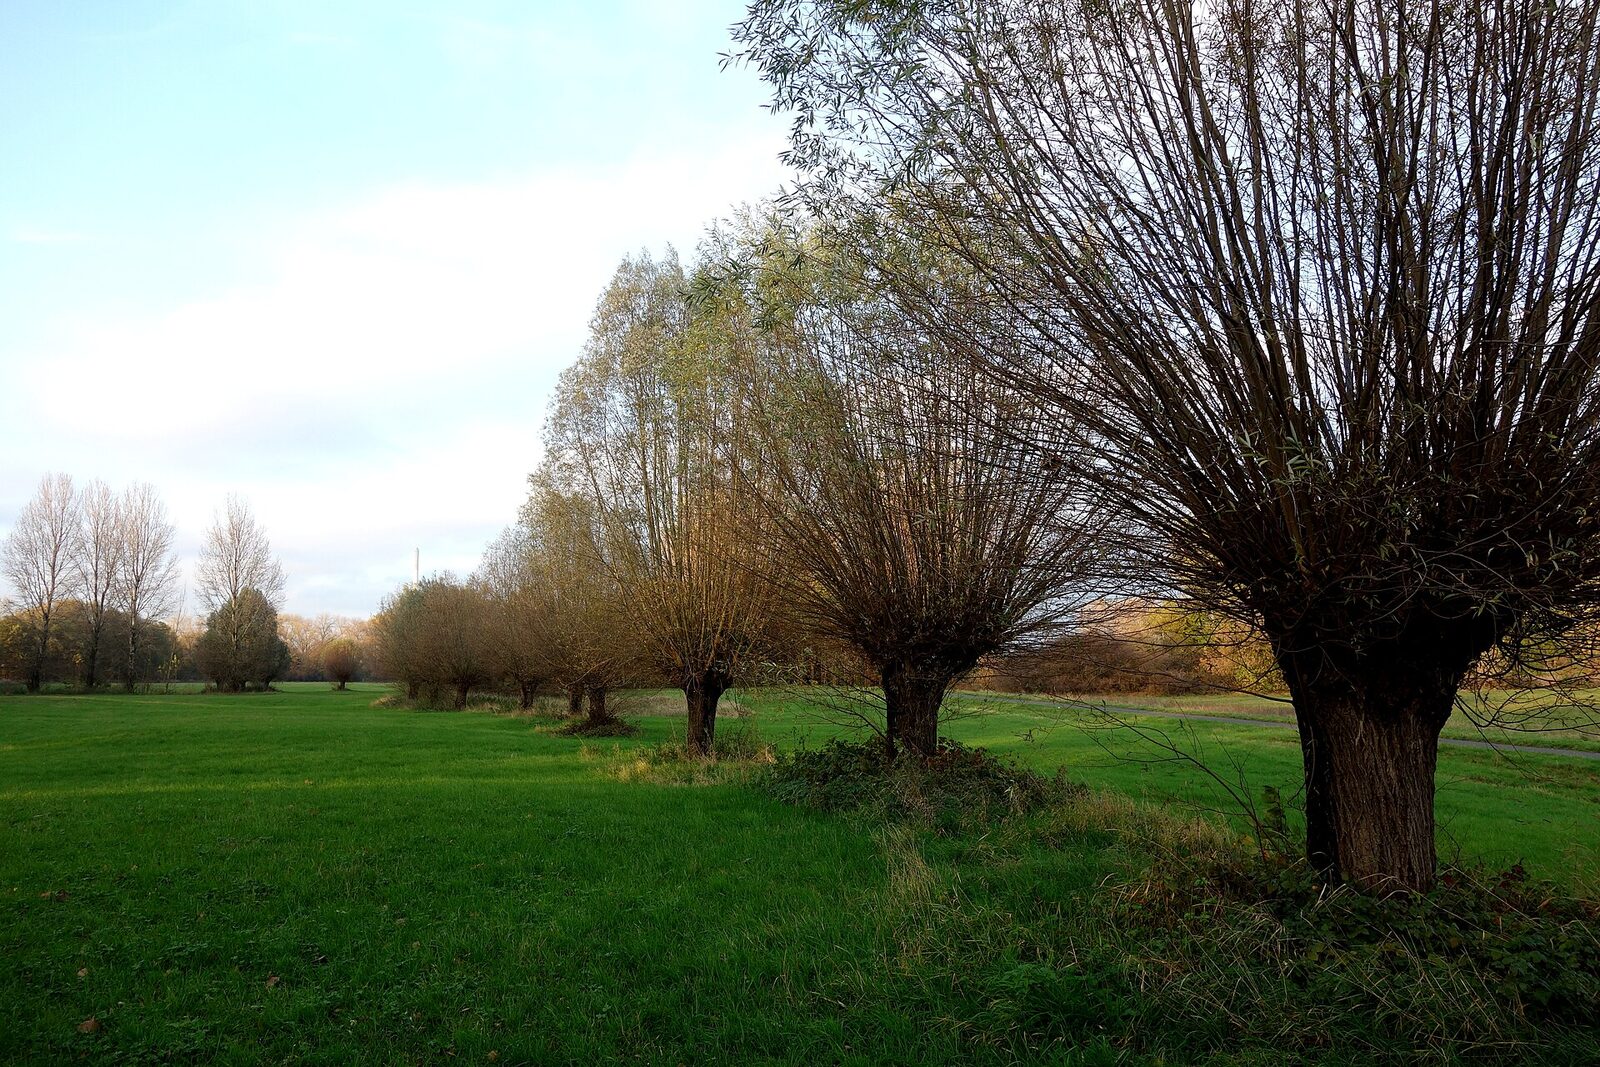
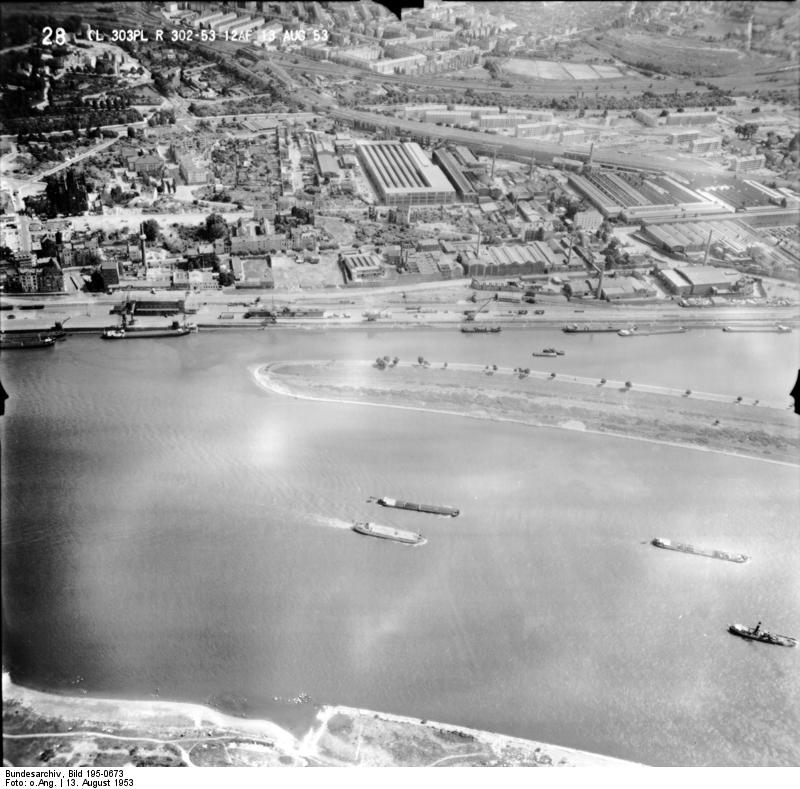
Mülheim is a district on the right bank of the Rhine in Cologne, with historical roots in the Bergisches Land region, and it lends its name to the surrounding city borough. With around 43,000 residents (end of 2019), it is Cologne's most populous district.

Source: Wikipedia
Mülheim
© Autor/-in unbekannt · CC BY-SA 3.0 de
0
Inhabitants
0 km²
Area
0
Inhabitants/km² · Cologne 2,716
0
Households

Each bar shows the share relative to the highest value among 86 districts; the line marks the Cologne average.

Compare with borough & neighbouring districts

Tick areas — their values appear as coloured markers on the bars below.

Age structure

0–17 yrs15.8% · CGN 15.7% · Rank 59/86
18–30 yrs17.3% · CGN 16.1% · Rank 13/86
30–65 yrs52.8% · CGN 49.9% · Rank 7/86
65–80 yrs10.1% · CGN 12.5% · Rank 78/86
80+ yrs4% · CGN 5.8% · Rank 75/86

Source: Cologne neighbourhood monitoring

Population & social

migration background58% · CGN 43.1% · Rank 17/86
foreign nationals35.3% · CGN 21.6% · Rank 9/86
unemployment rate14% · CGN 8.8% · Rank 11/86
on benefits (SGB II)10.8% · CGN 6.1% · Rank 12/86
employment rate57.6% · CGN 60.1% · Rank 62/86

Source: Cologne neighbourhood monitoring

Households

single-person55.9% · CGN 51.9% · Rank 14/86
couples with children12.4% · CGN 13.7% · Rank 71/86
single parents4.6% · CGN 4% · Rank 40/86

Source: Cologne neighbourhood monitoring

Land use

green space (total)13.8% · CGN 44.9% · Rank 75/86
parks9.4% · CGN 10.3% · Rank 45/86
forest3.4% · CGN 18.7% · Rank 63/86
water9.9% · CGN 4.8% · Rank 16/86
built-up52.6% · CGN 32.9% · Rank 18/86

Source: Cologne neighbourhood monitoring

Political leaning

NRW state election 2022, party-list votes — bars relative to the strongest result, percentages beside.

Tick areas — their values appear as coloured markers on the bars.

CDU16% · CGN 24.6% · Rank 81/86
Greens33.1% · CGN 30.6% · Rank 16/86
SPD24.5% · CGN 23.2% · Rank 53/86
AfD3.5% · CGN 3.6% · Rank 60/86
The Left7.6% · CGN 3.7% · Rank 2/86
FDP4.3% · CGN 6.4% · Rank 78/86
Volt3% · CGN 2.4% · Rank 11/86

Source: Election and structural data, Cologne geoportal

Per 10,000 inhabitants

Counts in the area, relative to population — fairly comparable.

Tick areas — their values appear as coloured markers on the bars.

Family & everyday

Schools3.5 · CGN 3.2 · Rank 26/82
Daycare1.6 · CGN 1.6 · Rank 38/70
Playgrounds5.6 · CGN 6.4 · Rank 54/85
Libraries0.2 · CGN 0.3 · Rank 30/30
Supermarkets4.2 · CGN 3.4 · Rank 20/86
Weekly markets0.5 · CGN 0.4 · Rank 30/86

Health & mobility

Hospitals0.2 · CGN 0.3 · Rank 20/86
Pharmacies2.3 · CGN 2 · Rank 22/86
Transit stops3.5 · CGN 3.9 · Rank 35/52
Recycling points7.4 · CGN 9.5 · Rank 56/86
Drinking fountains0.5 · CGN 0.2 · Rank 12/86
EV charging3 · CGN 4.2 · Rank 47/86

Sources: City of Cologne open data & geoportal (schools, daycare, playgrounds, transit, hospitals, libraries) and OpenStreetMap contributors (ODbL; pharmacies, supermarkets, markets, recycling, fountains, EV charging)

What's in this area

Counted within the boundary from open data — City of Cologne (geoportal/open data) and OpenStreetMap contributors (ODbL). Every number links to its source.

Neighbouring districts
Buchforst
Average age
43 (5.)
Employment
58.3% (6.)
Strongest party
SPD
Green space
14.7% (8.)
Buchheim
Average age
41 (9.)
Employment
58.2% (7.)
Strongest party
SPD
Green space
35.5% (6.)
Dellbrück
Average age
45 (1.)
Employment
61.4% (1.)
Strongest party
Grüne
Green space
52.3% (3.)
Dünnwald
Average age
43 (7.)
Employment
57.5% (9.)
Strongest party
SPD
Green space
76.6% (1.)
Flittard
Average age
43 (4.)
Employment
60.2% (2.)
Strongest party
SPD
Green space
52.5% (2.)
Höhenhaus
Average age
44 (3.)
Employment
58.8% (5.)
Strongest party
SPD
Green space
40.1% (5.)
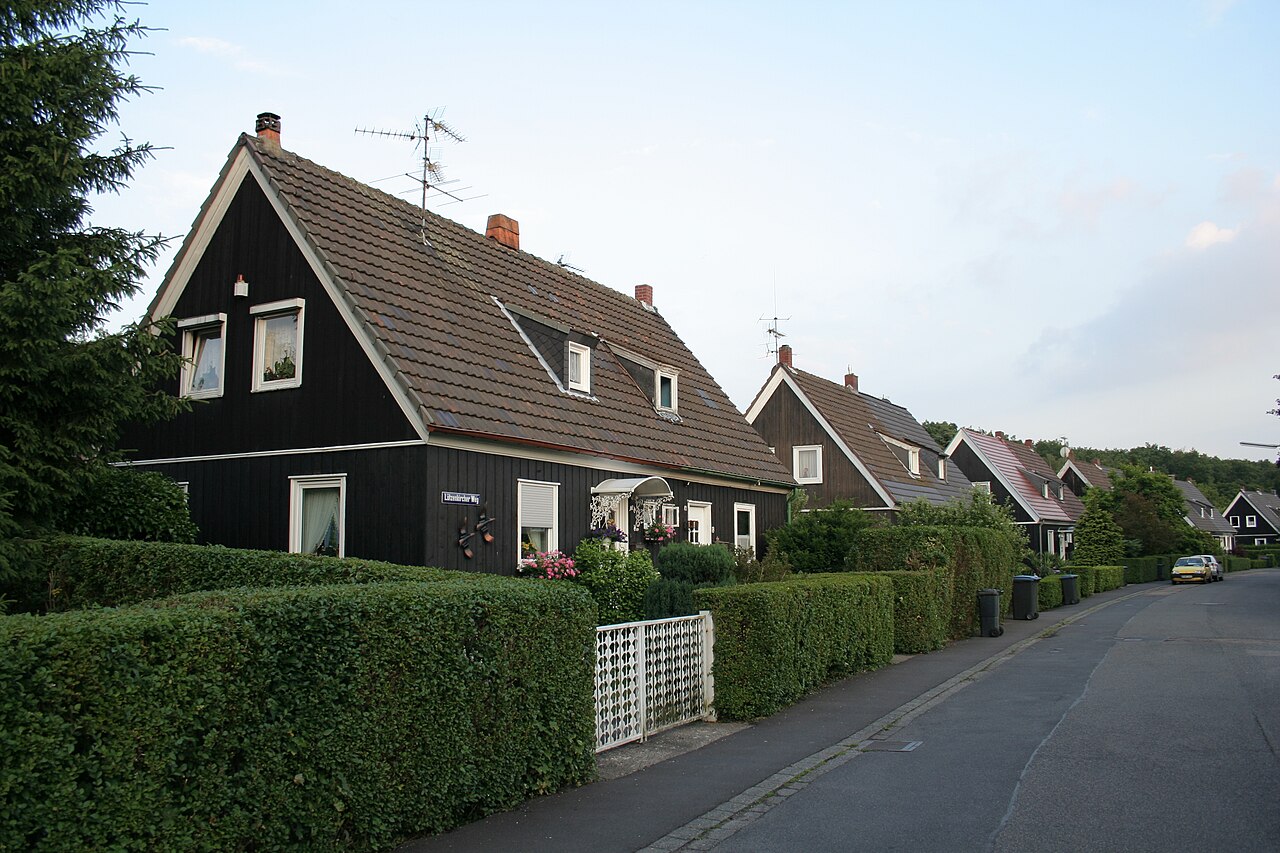
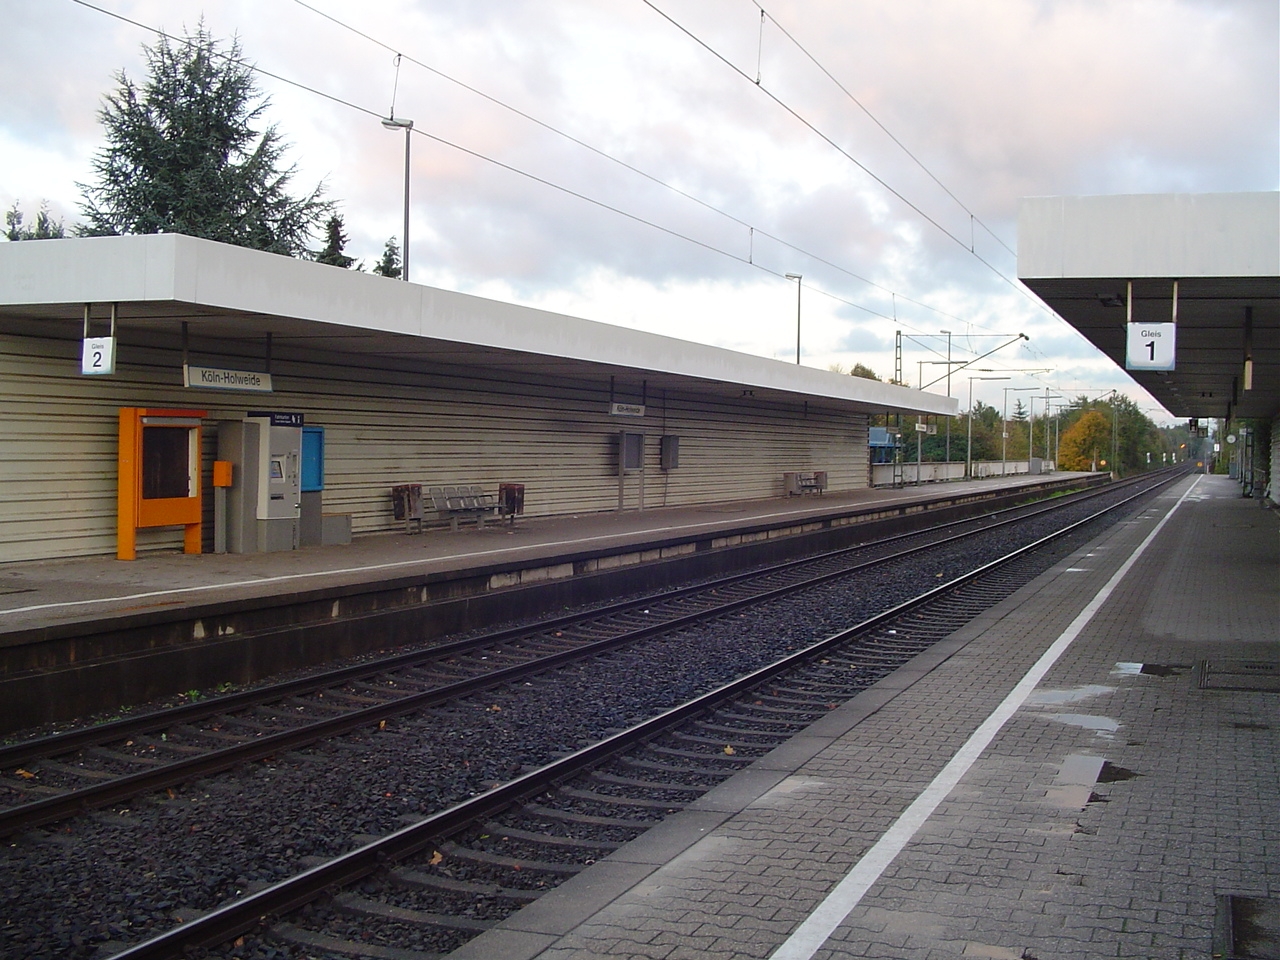
Holweide
Average age
43 (6.)
Employment
59.5% (3.)
Strongest party
SPD
Green space
27% (7.)
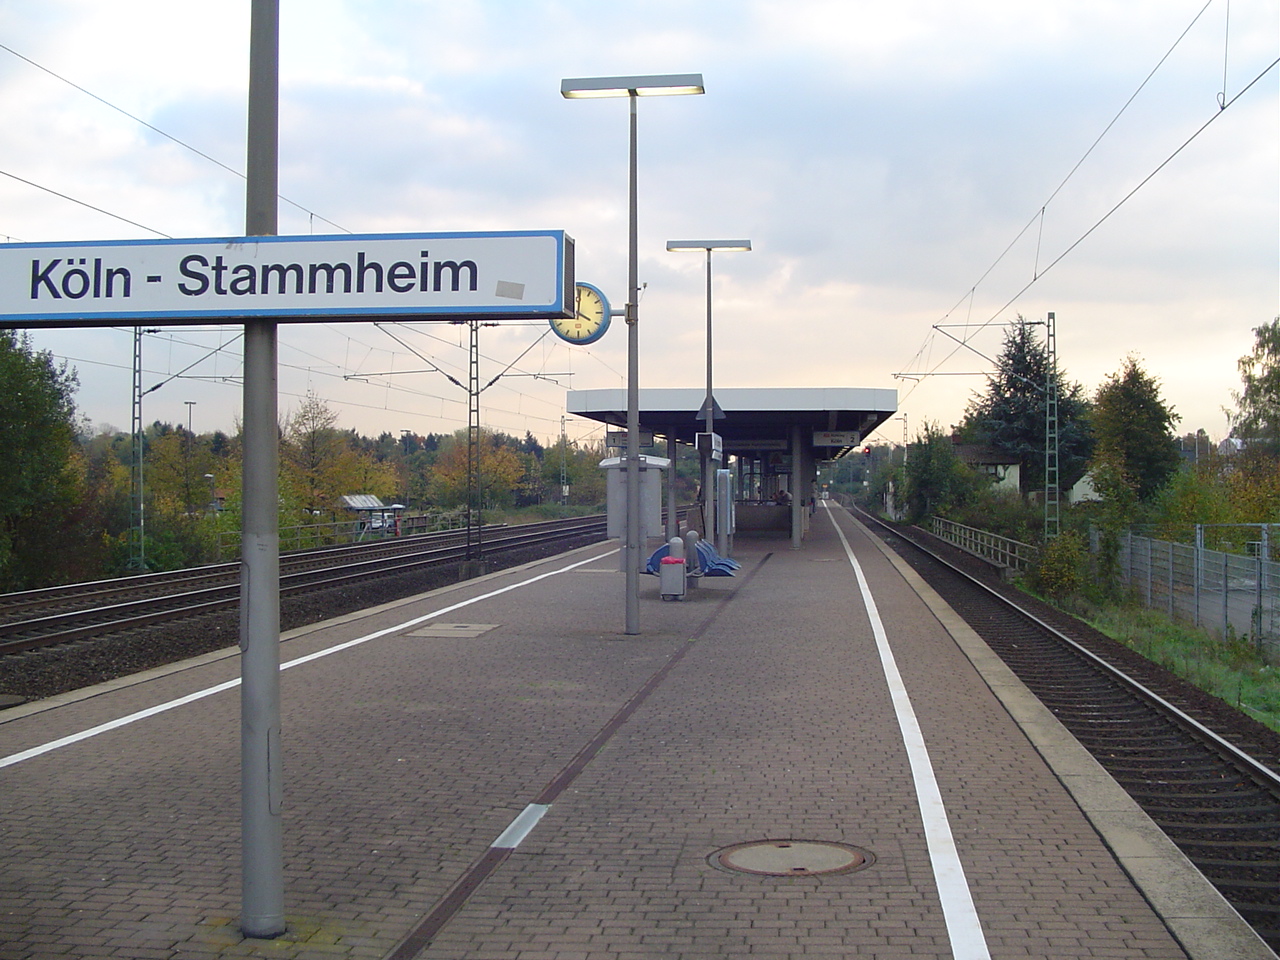
Stammheim
Average age
44 (2.)
Employment
59.3% (4.)
Strongest party
CDU
Green space
40.6% (4.)

Comments

  • Loading comments…

Sources & links

How this page is made

This page draws on open sources — Wikipedia, Wikidata, official websites and the city’s open data. Every statement is checked against the sources linked here, and pages are refreshed regularly.

Spotted a mistake anyway? Tell us below — we read every submission.

Something missing or wrong?

Help us improve — suggest an edit or a new place.